
A World Cup of Enchanted Bibles
How can the World Cup forecast market transactions be tactical? One-time talk about all the football forecasting strategies and how to implement them. 。
Original by:@MrRyanchiI don't know@insidersdotbot founder
Preamble
It has been a long time since the last article. In the meantime, I've been studying new strategies and grinding our trading terminals a million timesi don't know, insidersI don't know. And the World Cup, it's definitely an instant of "The mule is the horse, the horse is the horse." A strategy to test whether our products can be applied to the general public, and to make the World Cup a chance for a successful deal。
So, the article would reframe all the strategies that could be used effectively in the World Cup in the past. Those are the ones that inspired our version of the product today。
Newi don't know, insidersThe most exciting part is not just the fast-down list, but it brings together a lot of things that were scattered on the screen: smart money signature, order book, TP/SL, second-grade document, filtered data, and AI Agent, who can ask questions directly in natural languages。
The World Cup is the best way to explain this. It is enough for the public and everyone has emotions; it is enough for the low score, and a small variable changes the entire path. A forwarder's absence, a red card, a refraction ball of 0.08 x G at a time, and a team's third net winning ball are all likely to allow the champion's probability, the probability of going out and the market price to move simultaneously。
So, back to strategy -- this isn't about "who's winning." To be honest, no one is right。
What I would like to open is another thing: when the World Cup turns into a forecast of prices in the market, how exactly are we going to break emotions into variables, compress them into probabilities, and put probabilities before prices。
If the sentence is summed up: Science predicts the World Cup, not the only future, but all possible futures are put on the table, priced and then disciplined。
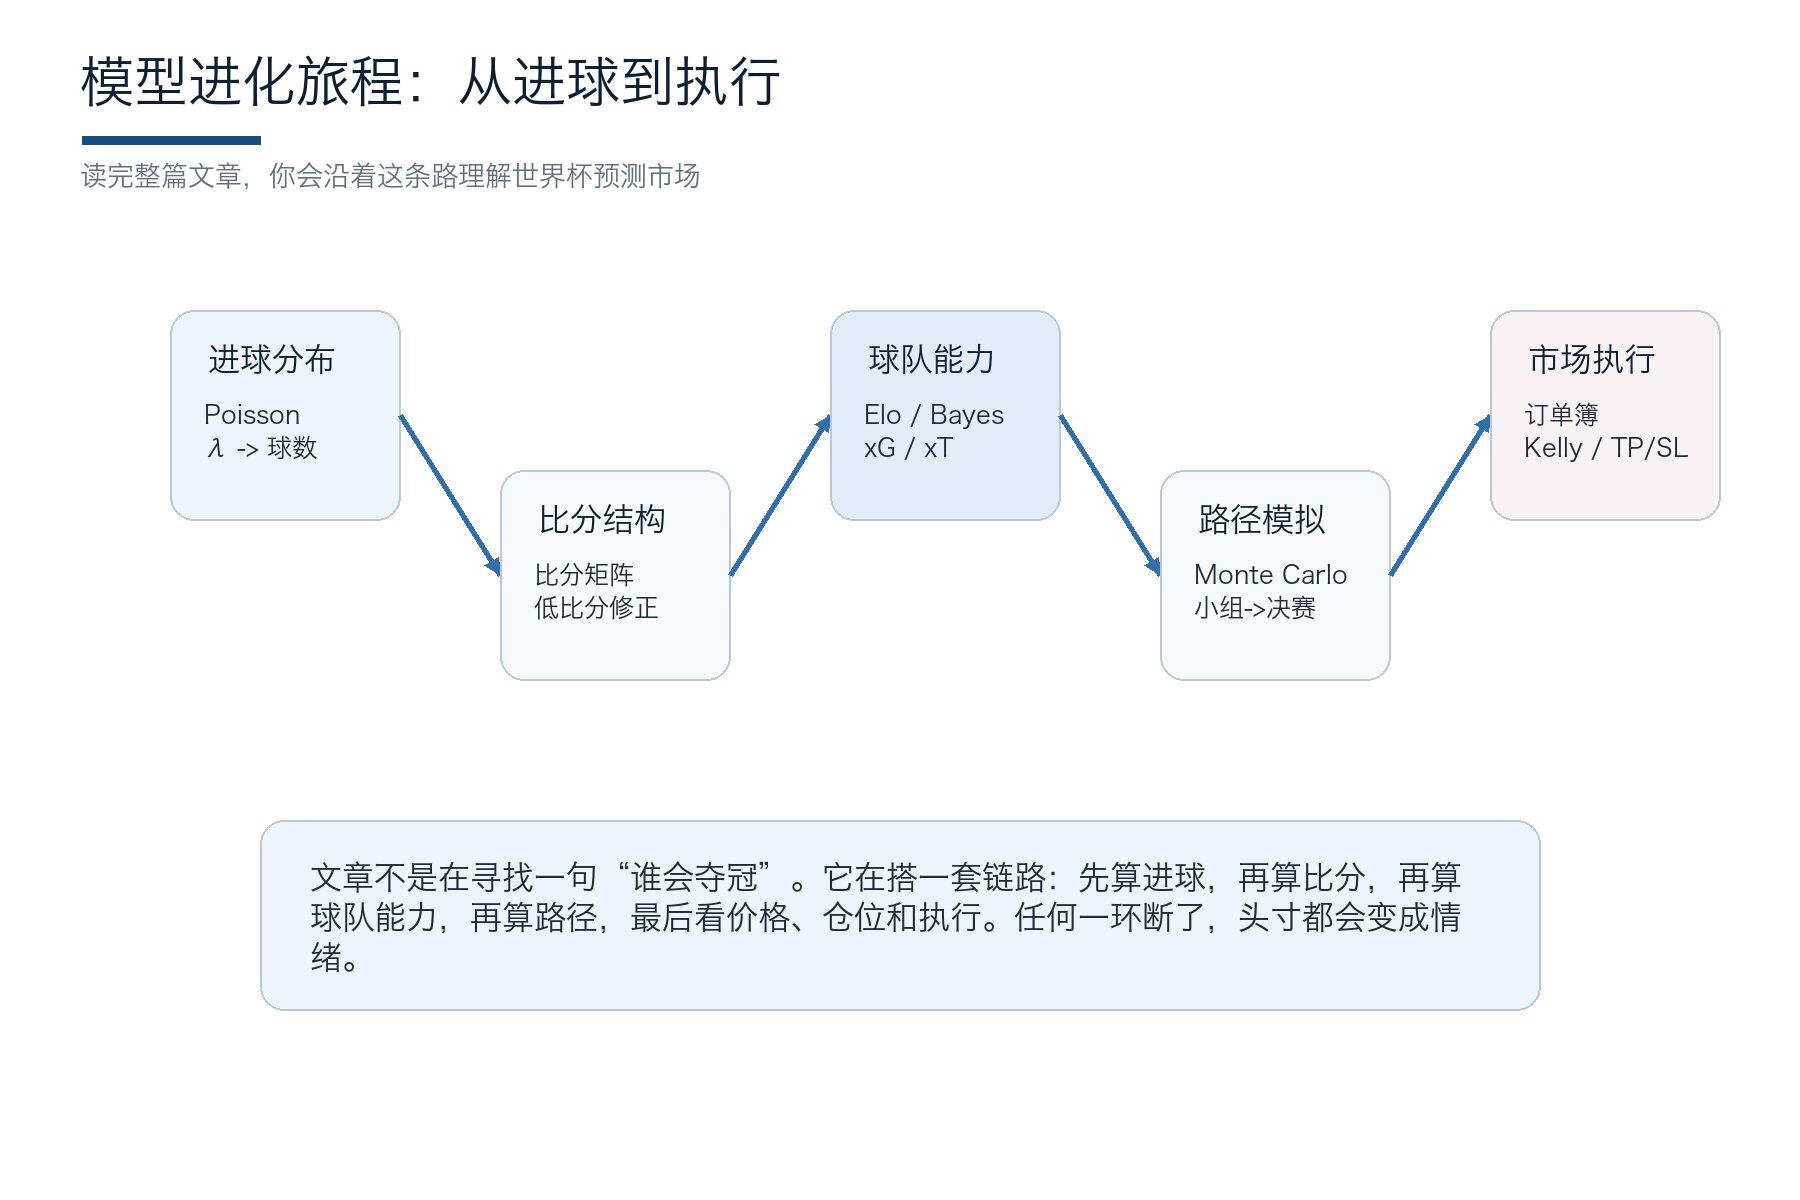
This article will show you, with the wheel of history, the evolution and evolution of strategy from a hundred years ago to the present, so that you can learn the essence of every strategy。
At the earliest, people were just asking: How many goals can a team get on average? So Poisson came out and turned the feeling of strength and weakness into a goal distribution。
Soon, you found that the averages were not enough and the score was structured, so the score matrix, Dixon-Coles, Bivariate Poisson and Skellam continued to tear football down even more。
In the future, the question went from “a few” to “how strong the team is”。
Then Elo, Bradley-Terry, ordered logit gave us a long-term base of strength and weakness; Bayesian hierarchical told us that the country team had fewer samples and could not be run by a big victory or a cold door; xG, xT, VAEP re-opened the process behind the score to show us the quality of opportunity, the right push and the value of action。
Finally, models must go into the market. Machine learning and ensemble are responsible for rubbing information. Together, Monte Carlo simulated the teams, the knockout and the half-sector paths, and the order book told you whether the theoretical price was real or not. Kelly and TP/SL decided if you could survive the finals. When you read it later, you find this paper asking not who wins, but where the probability comes from, why the price moves, how the transaction is executed and reset。
With this road map, each section that follows is no longer an isolated concept. Instead of starting with formulas, we put the World Cup back in the price system of the forecast market from the emotional scene. Only when we know what contract prices mean, and when we discuss goals, paths and positions at the end, will we not turn into pure technology。
I. Consider the World Cup as a probability asset
A new perspective: the World Cup certainly has emotions, national narratives, and a giant star, but the forecast market is concerned only with one thing: whether the probability of a given future occurs right or not。
1.1 Why special in 2026: Contest expansion transforms champion markets into path assets
The World Cup expanded from 32 teams to 48 teams, 12 four teams, with the first two teams and the third of the best eight teams each entering the top 32, and the champions needed to kick eight. In the FIFA official game note, these figures appear to be only organizational; they are placed in a trading perspective, which implies an expansion of the state space, an increase in path dependence and an increase in the number of market revaluations (FIFA World Cup 2026)。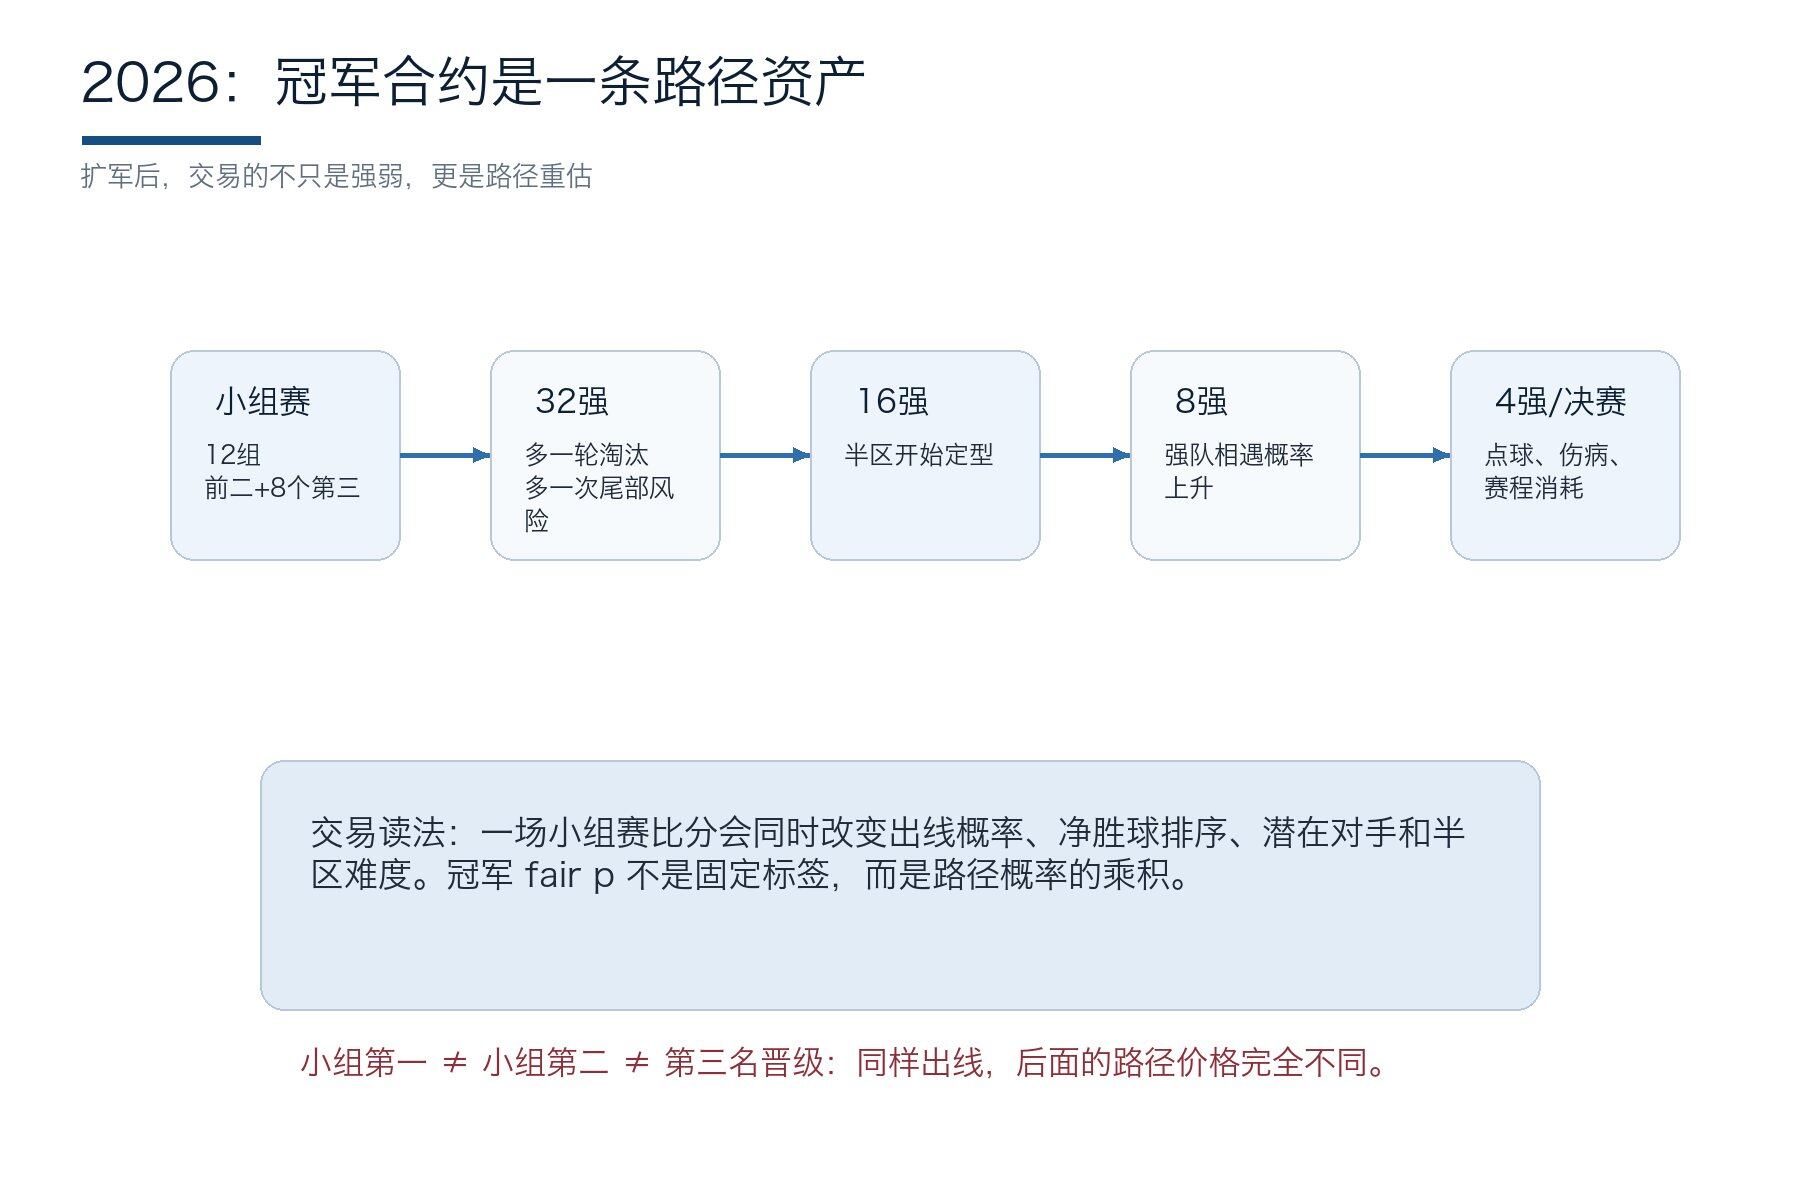
In the past, many of the powerful teams could enter the phase-out path with relative clarity as long as they managed to get to the top of the team。
the third promotion in 2026 will make the final round more like a complicated payoff table。
- A team may not need to win, but just lose less
- A team may have been out of line, but it still has to fight for the half sector
- One team may appear to be third in rank, but the real chances of promotion are changing rapidly as a result of other groups。
This is critical for predicting markets。The championship contract is not a one-time win, but a path probabilities。The probability of winning can be roughly written: the probability of a team going out of line multiplied by the probability of a promotion per round. One more kick, one more red card, pointer, injury, weather, referee scale and tactical mismatch. The strength of the strong will accumulate, as will the risk of the strong。
So the right deal for the 2026 World Cup is not just who the champion is, but the path itself: team out, half a block strong and weak, third promotion, avoiding strong enemies, eliminating point-to-point risk, and driving. The market gives a total price before the race and the path is constantly re-priced during the competition。
So what traders have to do is to know which path is seriously undervalued before re-prices occur。
1.2 Immediate reference
Take a race case. Assuming the price of a pre-competition champion is 12 percent, it's the first one to zero small team, and the market probably only understands it as "three points." However, if another hot-gate cold-dropping ball of the same group, the team's first probability, the probability of avoiding the strong half zone, and the strength of the eight former rivals will all change。
Dealers should not just ask if it's a good kick, but start running again: The Panel's first probability rises from up to up, the possibility of a third round being rotated, and whether the half sector becomes loose。
such windows are best prepared in advance. prior to the opening of the competition, each set of keys is better than the partition; when prices move in the competition, the order book is used to look at the real ask and depth rather than just the middle of the page。
Ifi don't know, insiders24 hours of smart money filtering signals suddenly signal both the offline market and the champion market of the same group to warm up as a reminder that someone is trading the path and then go back to their model to check for approval。
When the game is over, the real model begins. The more complicated the path, the more likely it is to end up in a game: a couple of goals for each team, which will determine the chances of winning or losing, and whether you should express the champion, the line, the ball, the ball, the exact score, or not. In other words, the first way to model is not to guess the champion, but to figure out the single goal distribution and then decide which market to place。
II. Model bottom: from goal goal distribution to score matrix
This part starts with the bottom engine. Readers do not need to write code at the outset, but understand that all odds, balls, chances of promotion end up out of a bunch of concrete odds。
In chapter II, we learn two basic knowledges, one of which is Poisson (Porsson distribution), for probabilistic calculations. One is the matrix, and this is the framework of the model。The combination of the two results in a Dixon-Coles model, which is used to project the ratio between the two sides。
2.1 Poisson, pull football back from the story
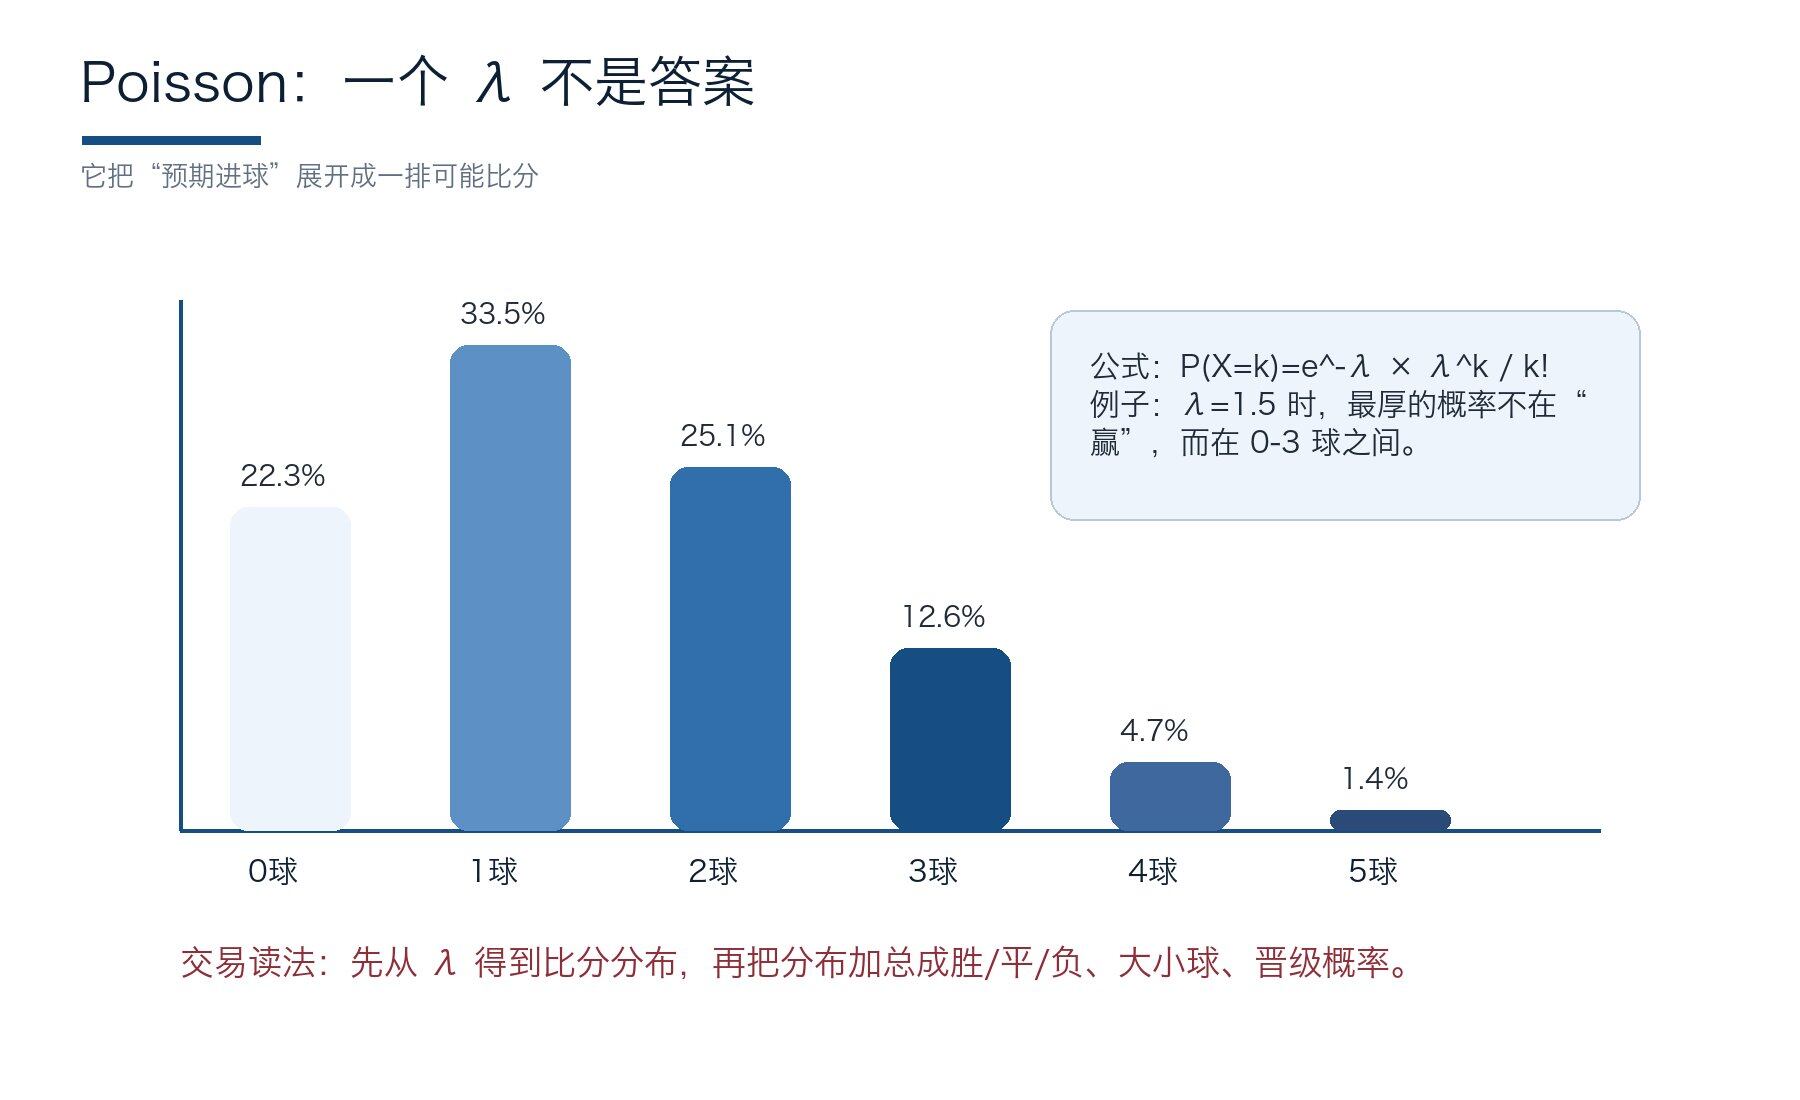 Figure 1: Poisson distribution: A poisson is extended to 0 balls, 1 ball, 2 balls, etc。
The first bridge of the football forecast is Poisson. Maher ' s 1982 classic paper, which places the team offensive, defensive and goal numbers in the same statistical framework (Maher). This step seems to be a simple one, but it determines the bottom colour of the next 40 years of football projections: no direct guess, no first-time goal。
Poisson's formula P(X=k)=e^-×xλk/k。
The symbols here mean the following:
- it's an average goal
- k is the number of concrete goals
if a team confronts an opponent's λ1.5, it's not "should go to 1.5," but it says, "in many similar games, its average goal is close to 1.5." the real game can only be zero, one, two, three, so the model expands 1.5 into a series of probabilities。
That's the difference between football and basketball and tennis. So football is a low score, so the weight of single goal is huge:
- A refraction ball of 0.08 x G, sufficient to change the situation of the group
- A door would be enough to destroy all pre-selection narratives
Poisson's value is to remind us not to write low-point movement into definitive novels。
falling into the trade, zen is the entrance to everything. you can get the score matrix from the twig, and you can add the sum of the win-win, the ball, the ball, the ball, and the exact score. the championship market seems to be very far away, but it's just putting a lot of competitions into the same tree. as soon as the entrance passes, the trees in the back grow crooked。
Don't rush down the equation. Thinking of Poisson as an interpreter is enough: it takes a vague word --"How many can this team make?"- Translating into a row of composing, comparable, tradable probabilities。
it's not the e side that readers really want to practice, but it's the habit of every time they look at the news, to ask which team it's changing, and how much it's changing. as long as it stabilizes, all the markets behind it will be clearer。
Virtual reference
A small operational example: Team A = 1.65, Team B = 0.82. The model does not mean that Team A is going to score 1.65 balls, but sets off the probability of Team A being zero, one, two, three. If you start off without the main force, you can lower the A team by 0.12 to 0.20; if there's only a replacement, it's probably 0.03. This move is more revolving than feeling weak。
this can be done by writing directly the rules: the core shooter is absent, the lower goal quality; the back of the main force is absent, the counter-attack is up; the rain and the low grass, the bilateral field is down。
When the rules are clear, AI Agent is well placed to help you translate news into parameter candidates, but it is up to your model and trade discipline to decide whether or not to adopt it。
Poisson gave us two teams a goal distribution, but traders can't just hold two. You need to know what the score is when these distributions meet, what's more than the subregion, whether you want to buy an A or an Under. So the next step is to fold the distribution of the two teams together into a score map that can connect directly to market options。
2.2 Ratio matrix, real engine of single-field probability
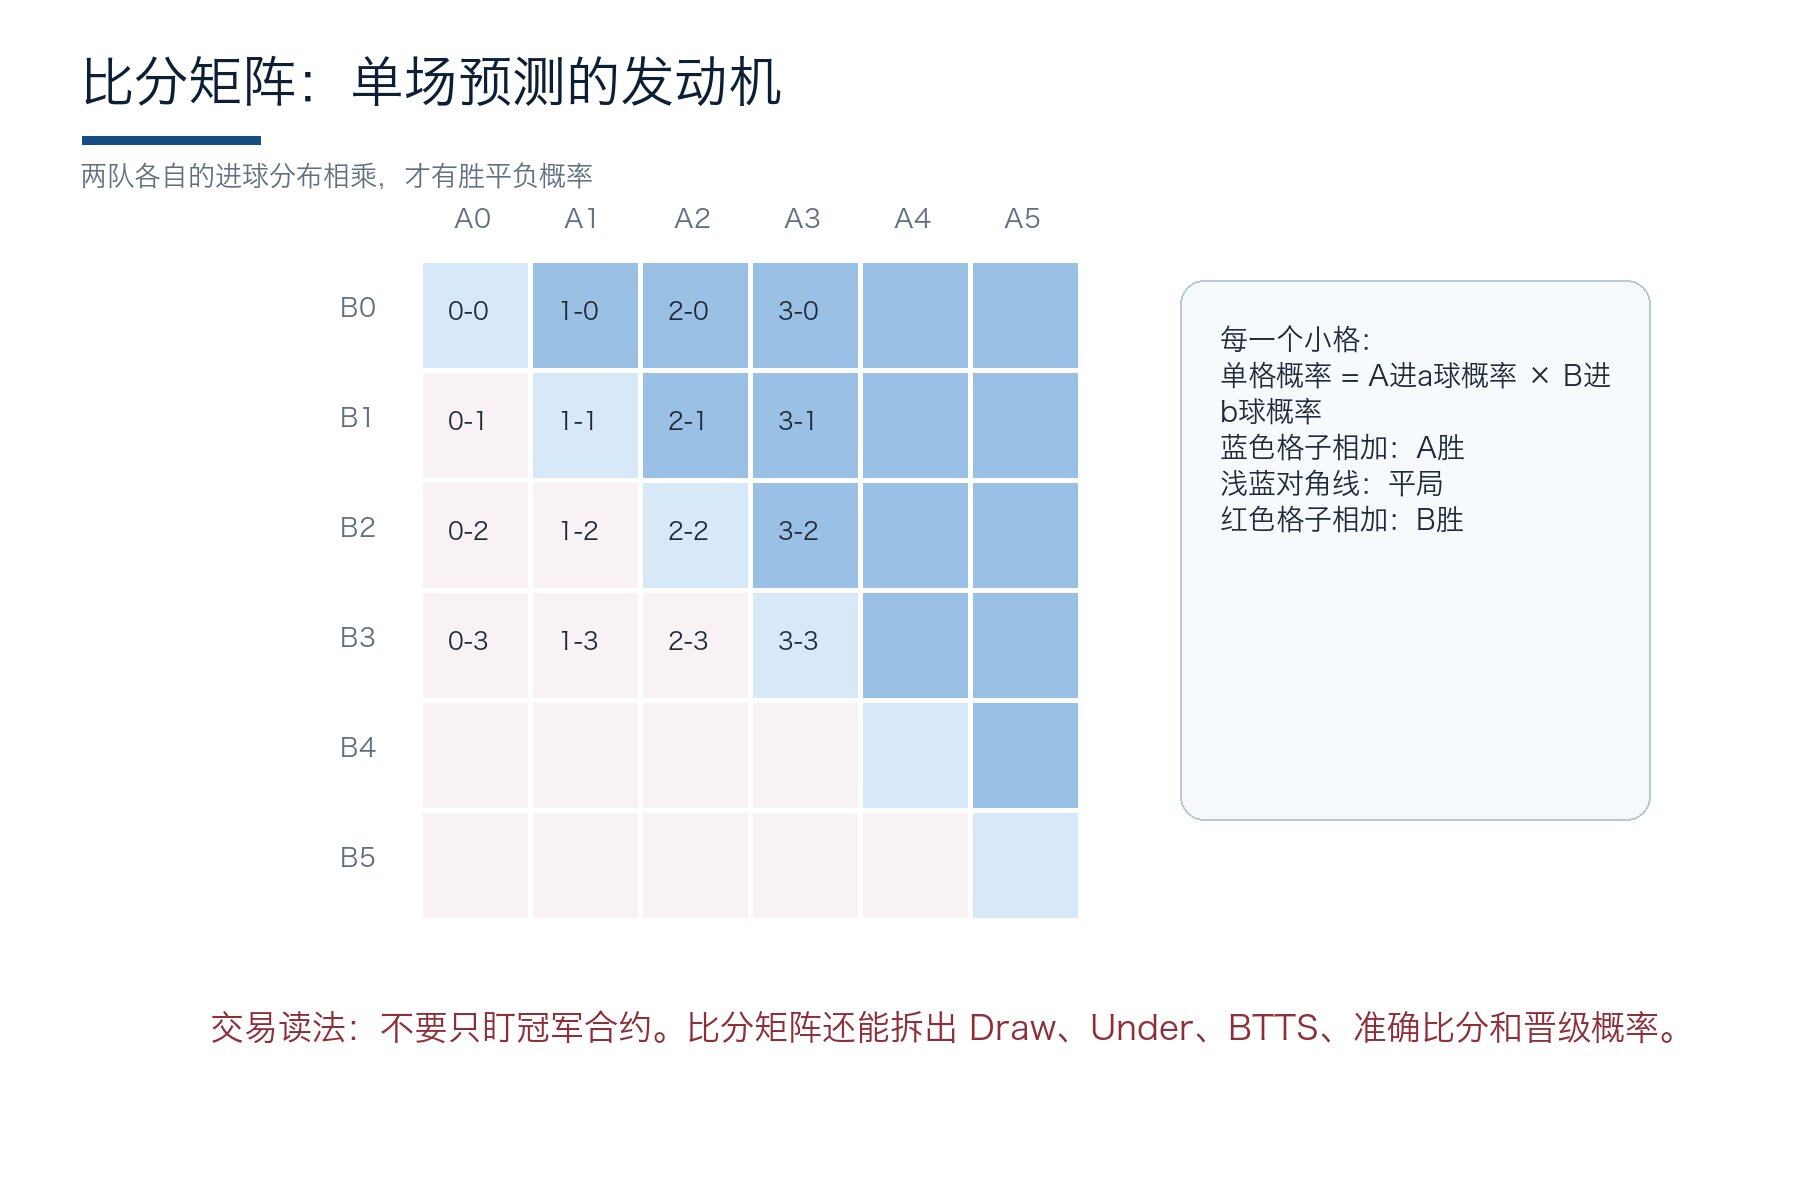
Figure 2: Ratio matrix: after two teams have multiplied the goal distribution, the sum is equal to the sum of the winnings and the derivatives market。
When many of those who have just arrived talk about predictions, they jump directly to “how much is this team winning”. More like traders, it's a pre-laying scale matrix. Assuming the goal distribution of Team A has been calculated, the goal distribution of Team B has been calculated. By multiplying the probability of A going into a ball by the probability of B going into a ball, you get the probability of a-b this ratio grid。
- The upper left corner of the matrix is 0-0, 1-0, 0-1, 1-1; the lower right corner is the end of the high ratio。
- ADD ALL THE CELLS THAT HAVE A GOAL GREATER THAN B. IT'S A
- Equivalent grids add up, it's a tie; (Slight blue)
- LESS THAN B WINS
This process is slower than the direct success rate, but it retains its structure. Structure, that's what deals can do。
For example, both games give Team A 55% chance of winning. The first comes from 2.0 vs 1.2, the second comes from 0.9 vs 0.4 low rhythm consumption. The odds are the same: the size of the ball, the tie, the red card sensitivity, the post-replacement risk, and the probability of phasing out the game. The market sometimes compresses them into the same headline probability, and models have to tear them apart。
And that's why in the World Cup, Drew and Under are often cleaner than Winner. A lot of people in the market like heroic narratives, prices tend to favour hot teams, and the low-rate grid silently tells you that the strong are dragged into the mud。
Virtual reference
The score matrix is the best place to take a view. For example, you watch Team A, but the matrix shows that A wins are concentrated on 1-0 and 2-0, rather than 3-1, 4-1, so the more natural expression may be not to buy Team A, but rather to buy A, Under, or an accurate score. Many losses were not in the wrong direction, but in the wrong market。
Read the order book first on the disk. If A's winning market is very deep and prices are well reflected, then Underwood's ask is still low, and the transaction should be turned to a market that is more expressive。
i don't know, insidersThe order book analysis is not decorative here, but it solves a real problem: whether your model can be bought at acceptable prices。
The score matrix can answer a lot of questions, but it has a natural weakness: It's too much like a calm math table to underestimate the most sensitive low score in footballI don't know. 0-0, 1-0, 0-1, 1-1 is not just four grids; they respond to team risk preferences, game time and group situation。
To bring models closer to real transactions, we must look after these low-end subregions alone。
Together with the Poisson in the first paragraph (2.1) and the score matrix in the second paragraph (2.2), we are finally going to see the full picture of this football strategy, the earliest and most common World Cup prediction model - Dixon Coles。
2.3 Dixon-Coles, low-number subregions need to be singled out Look
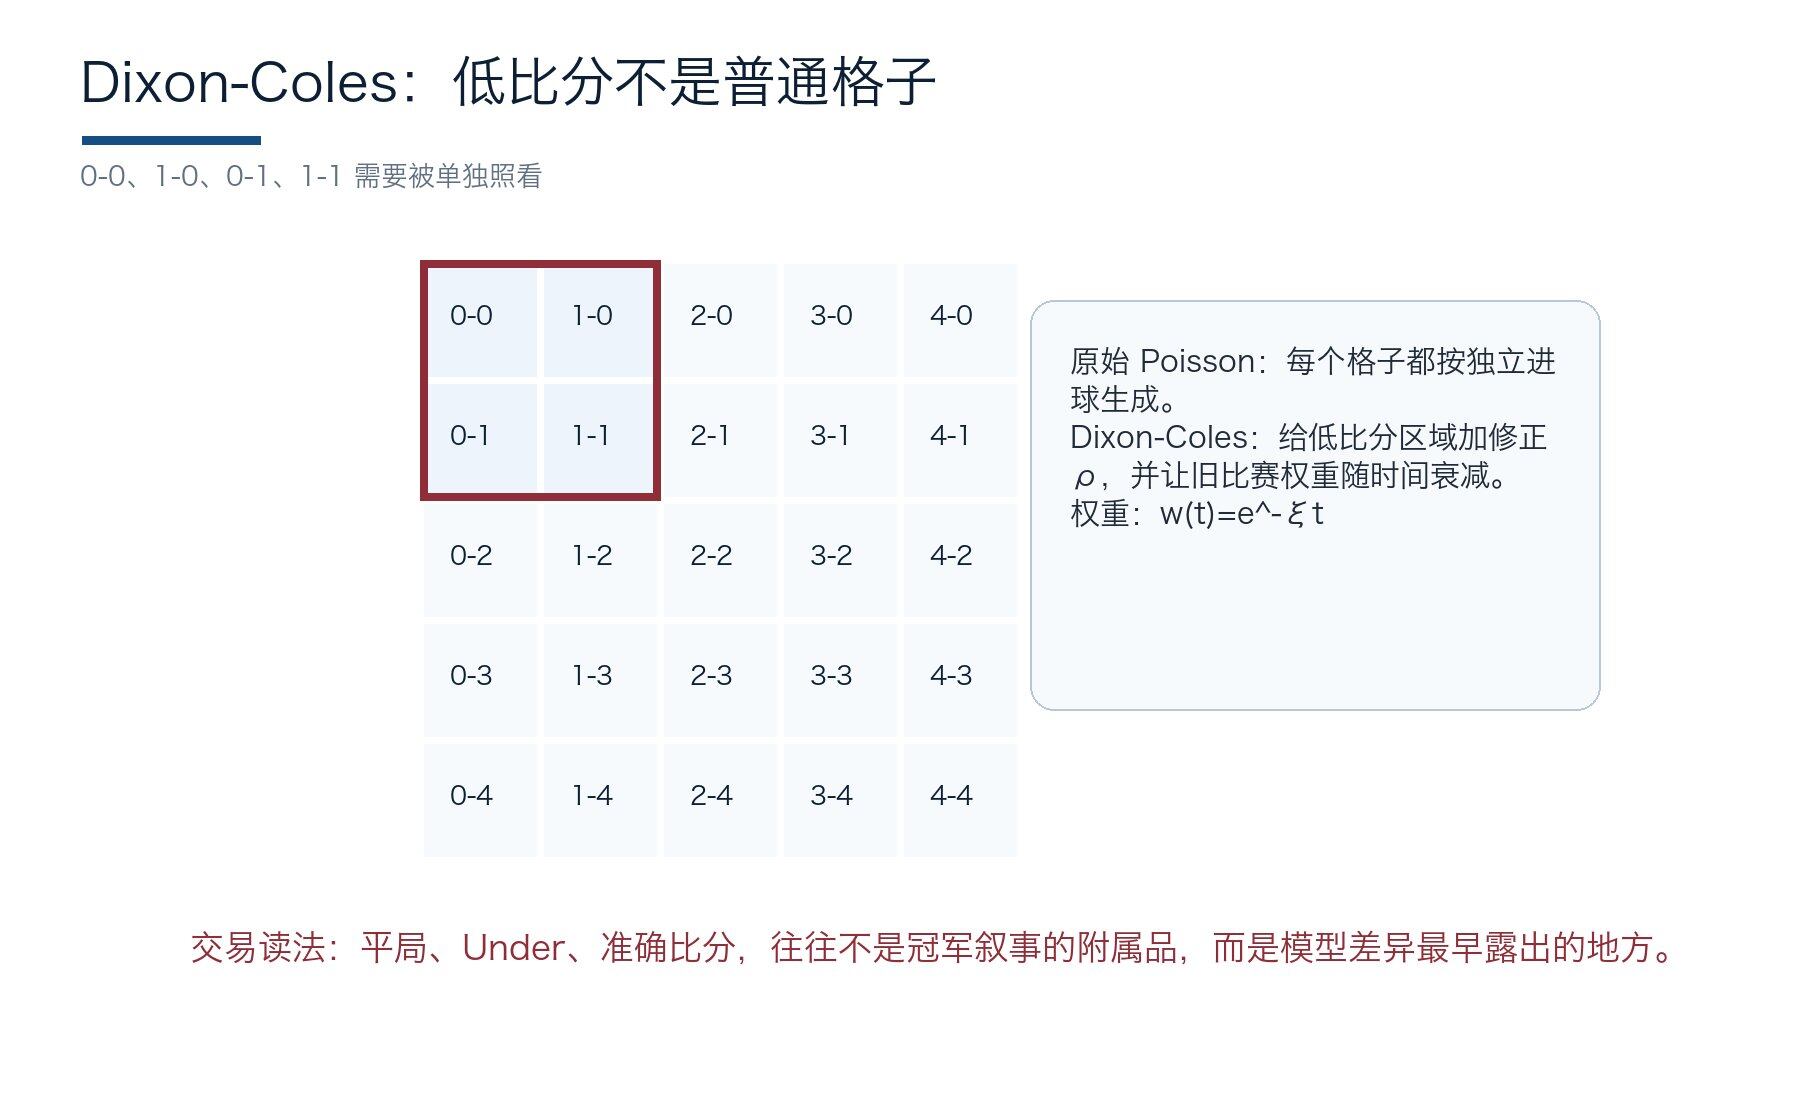 Figure 3: Dixon-Coles Revision: The low-weight subregion requires additional weight and time decay。
Dixon and Coles, a 1997 paper on the history of football as a model. They retained Poisson's skeletons, but pointed out that the low-coast subregions could not be treated in ordinary cells, particularly 0-0, 1-0, 0-1, 1-1 (Dixon and Coles)。
The reason is not the same. Football is not a double roll. At 0-0 hours, the risk preferences of both sides are different from 2-2; after 1-0, the lead party may contract and the backward party may press; and between 1-1 and 80 minutes, the strategy of the team and the phase-out is different. It's in the low-score box. It's the strongest strategy of football。
Dixon-Coles handles it in one of these low-rate cellsRelevance Amendment, while allowingThe weights of the old races decline over timeI don't know. Time erosion is well suited to national teams. The World Cup was valuable four years ago, but it could not coincide with last month's pre-selection; a friendship match had information, but it could not match life and death。
Dixon-Coles gives two directions:
- First, to find market underestimation of the draw and Under
- Second, when updating models before the race, do not mix old and new samples into a pot of porridge. If two successive low scores of a team during the World Cup were not due to a decline in capacity, but to a more conservative tactical choice, the championship contract might not have to be too low, but the Under, Draw, promotion contract might have changed。
Dixon-Coles is the most valuable place, not to add a beautiful parameter, but to remind us that football is not an independent coin. The score will change people, time will change risk preferences, and the team situation will change the selection of coaches。
So it's a low-rate correction that reads like statistics and actually looks like a ball. You need to know why one team is willing to put 1-0 in the end, and when the other team will take 1-1 as an acceptable result。
THE LOW-RATE CORRECTION ADDRESSES LOCAL STRUCTURES, BUT THERE IS A COMMON RHYTHM IN ONE RACE. THE WEATHER, THE RED CARD, THE FUR, AND THE OTHER SCORE OF THE SAME GROUP COULD INCREASE OR DECREASE THE CHANCES OF BOTH TEAMS TOGETHER. THAT IS, WE'RE GOING TO ASK NOT ONLY TEAMS A AND B, BUT ALSO WHETHER THE SAME GAME IS GOING IN THE SAME DIRECTION AT THE SAME TIME。
2.4 Bivariate Poisson and Skellam are not the shadows of the score
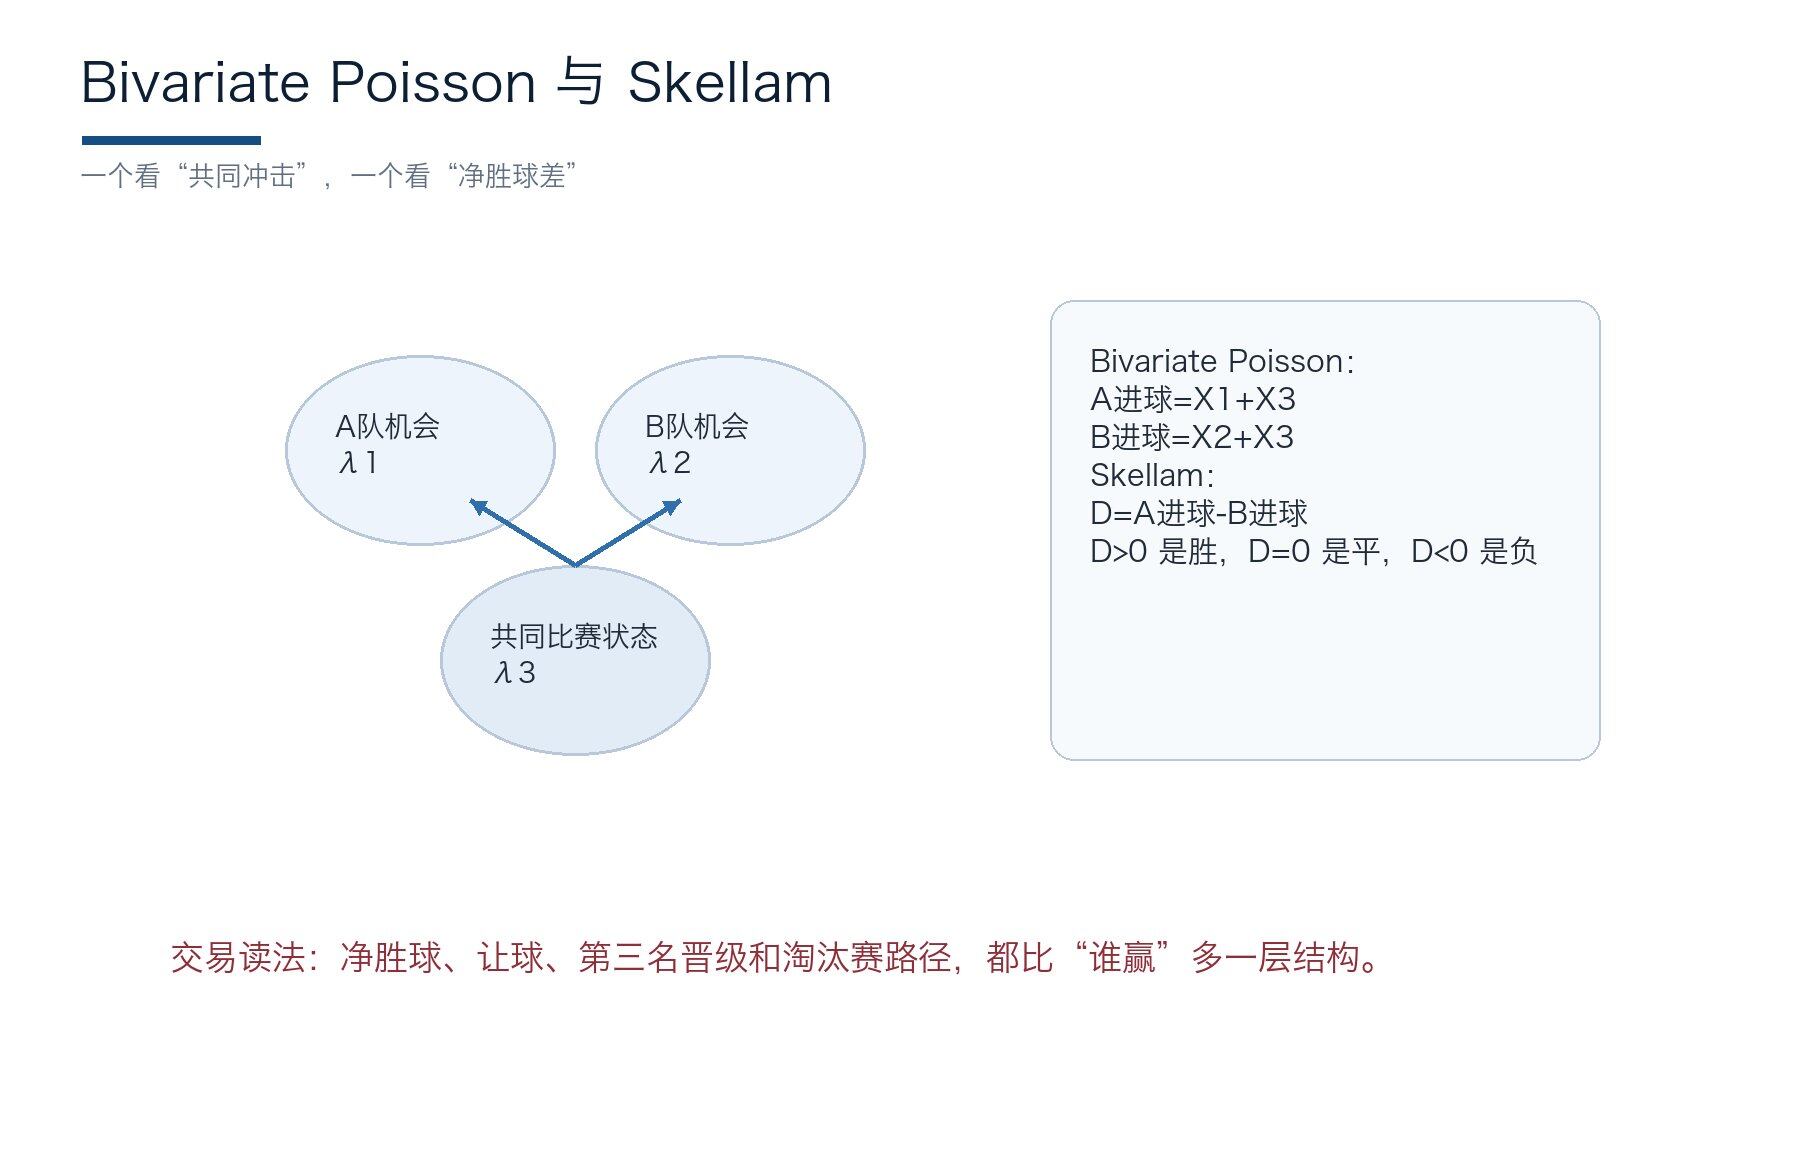 Figure 4: Bivariate Poisson and Skellam: Two expressions of shared shock and net winning。
Independent Poisson assumes that the two teams go their separate ways. In reality, the state of the game affects both sides. The bivariate Poison model of Karlis and Ntzoufras describes this homogeneity (Karlis and Ntzoufras) as a common impact item. Weathers, rhythms, referee scales, red cards, furs, and tactical openness can increase or decrease the chances for both teams to go together。
The significance of shared shocks is particularly evident in the World Cup。
- The final round of the group, which would benefit both parties if they were even, would naturally slow down
- If the phase-out comes early to the goal, the backward side presses and the lead side fights back, both opportunities may increase。
Seeing two teams as independent machines would miss such a diversion。
The Skellam distribution has a different perspective:YOU DON'T JUST LOOK AT A, YOU GET A FEW, YOU GET A FEW, YOU SEE A D = A-B。D> 0 is winning, D=0 is flat, D< 0 is negative. Skellam is useful for letting the ball, the net winner, the team ranking, and the third promotion, as these markets are concerned not with the score itself, but with the margin。
Dismantling, the netball market often reflects real motivation earlier than the champion market. The strong team leads 2 and continues to press, depending not only on strength, but also on the team's net win. When the third promotion rule was extended in 2026, the net winner would be converted from a “spring up” to a path asset。
Virtual reference
The third round of the panel was the most likely success. One team is already in hand four, and the other game results in it without losing two. At this point, its goal is not to win beauty, but to control tail risks. The model is designed to lower the high rhythm end, and the trade is re-oriented to the ball, Under, accurate score and exit market, rather than mechanically re-enacting the pre-game weakness。
If the inbound price jumps suddenly, it is clear first whether it is a fraction drive, another driver in the same group, or whether the order book is less mobile. Smart money signals can remind you of where there's money to go, and a second-rate documentary can help you catch a short window, but always, you know what kind of net-win scenario this window comes from。
Here, we can get from the goal to the end. But in reality, not every position needs to be accurately compared to the bottom; sometimes you only care who is more likely to win or whether the draw is underestimated. Next, instead of predicting the score, the results of the competition are treated directly as a classification issue, looking at how the winning, flat, negative boundary is driven by variables。
Pricing teams: strong and weak, process and non-linear
It's not enough with a single-field model. The difficulty of the World Cup lies in the small number of national teams, the rapid changes in their composition, and the frequent fragmentation of process data and results。
In this section, we will use five distinct but complementary approaches to tell you how to model the team's strength correctly。
3.1 Direct modelling is the other way round, Ordered Logit and Bradley-Terry
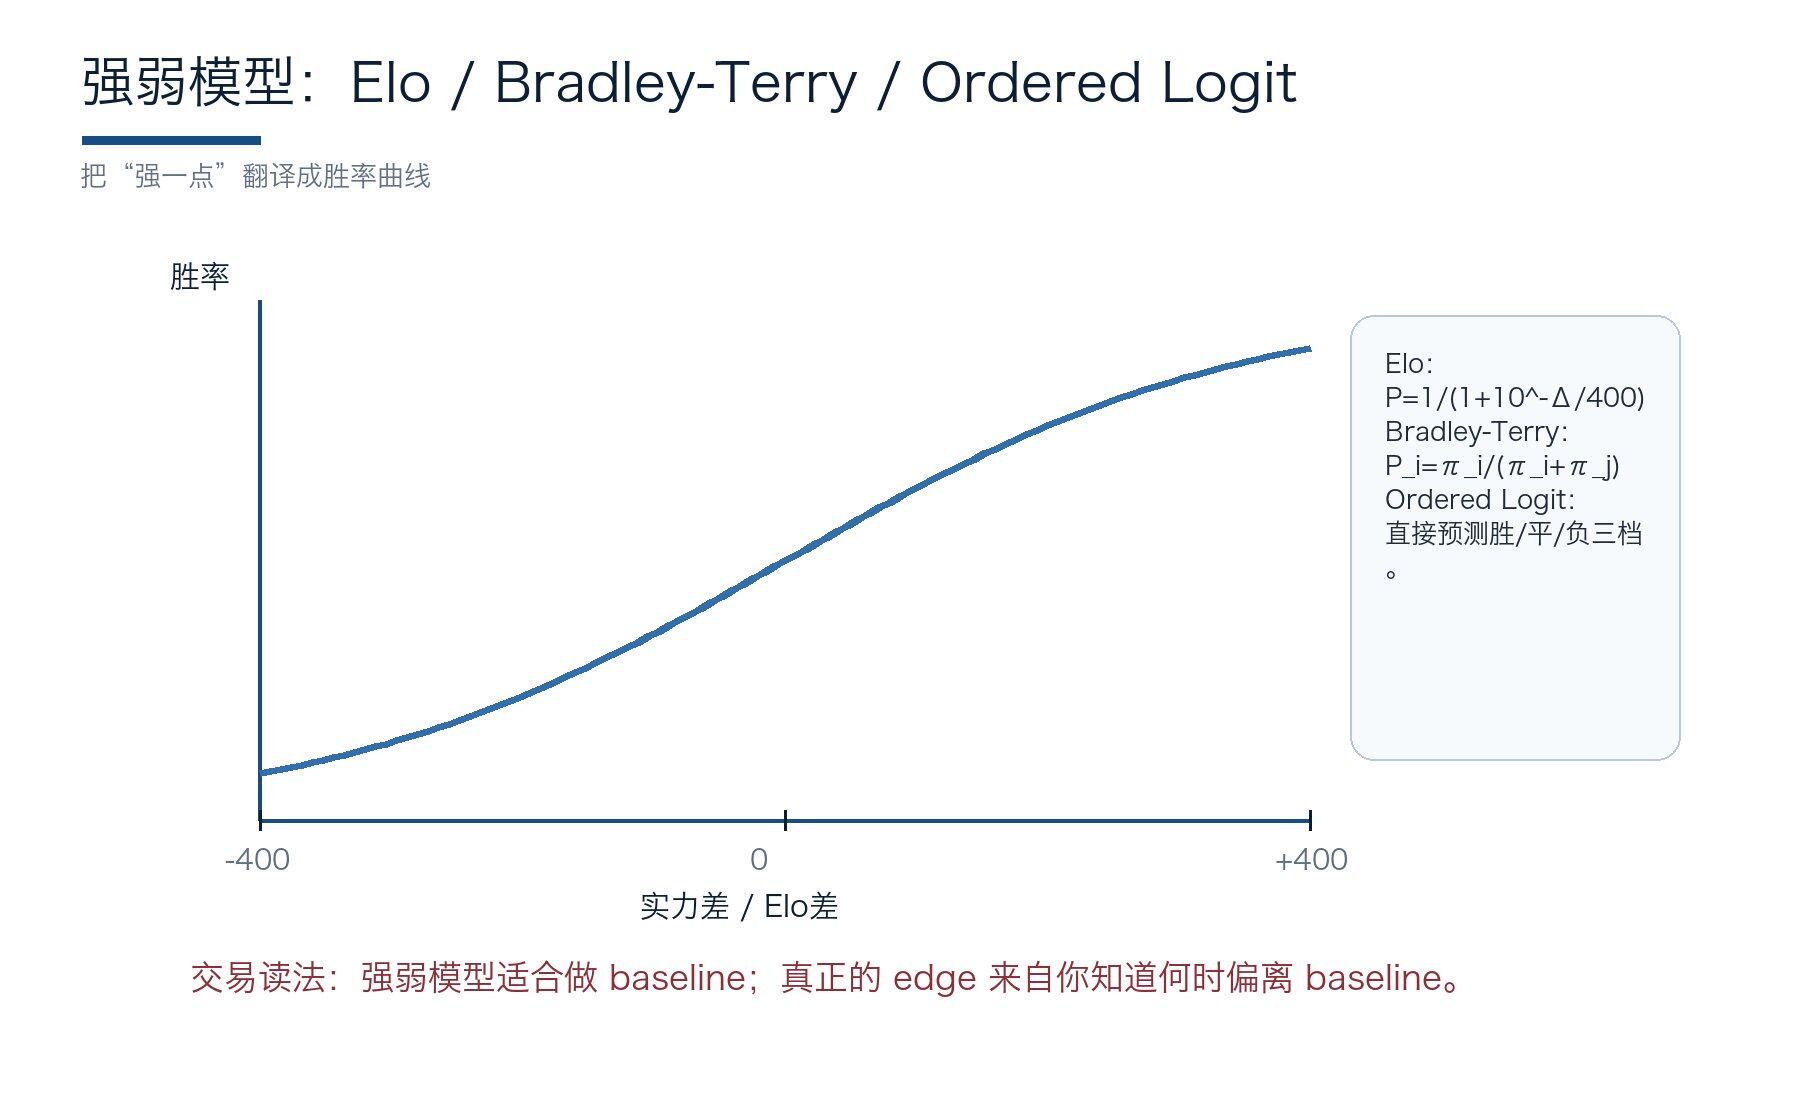 Figure 5: The strong and weak scoring curve: Elo, Bradley-Terry, and ordered logit are all answering how power differentials become probabilities。
Not all models must predict the score first. Another route is direct prediction of success, flatness and negativeness。
In International Journal of Forecasting, Goddard summarized two traditions: the number of modeled goal numbers and the results of the Goddard competition, which directly uses discrete options such as modeling。
The idea of Ordered logit is to rank the results in three levels: negative, flat, winning。The model is not concerned with specific 2-1 or 3-2, but only with how certain variables drive the result across the threshold。it is less than a fractional structure, but it is more direct and better suited to baseline when data are loud and the score details are difficult to estimate。
Bradley-Terry is older and cleaner. It looks at it as a comparison of two forces:
P(i beats j) = π i/ (i+πj)。
Tax and Justra have studied the performance of the Bradley-Terry Extension and Level Poisson log-linear model in the prediction of football results and have found that the ratio of direct modelling to success and modelling is not the difference between predictions (Tax and Justra)。
Football predicts the hardest part in the draw。Davidson's extension is one of the ways in the Bradley-Terry series to deal with the tie: It recognized that the draw was not an awkward gap between winners and losers, but rather a state in which football had to be priced separately. This falls into the trade, and it reminds us that sometimes, by abandoning the score details and directly modelling outcome, we get a more stable probability。
The results of direct modelling are cleanBut it still needs a long-term bottom seat。Otherwise, every game would be like re-reading two teams, and the model would be taken with short-term news。
So, in comparing strength to Bradly-Terry and Ordered Logit, we need to join Elo, Glicko and TrueSkill。The meaning of all three is to give the team a long-term capability curve, so that the one-time probability, the champion's probability and the path simulation in the back have an anchor that does not drift away。
3.2 Elo, Glicko, TrueSkill, three generations of strong and weak languages
Elo is one of the most durable tools in sports forecasting. It compresses the strength of the team into a new and updated number: much more to defeat the strong and less to defeat the weak; much to lose to the weak and less to the strong. Hvattum and Arnzen studied the Elo racings for football games, while Gilch and Müller used Elo-based Poison for the 2018 World Cup simulations (Hvattum and Arnzen; Gilch and Müller)。
Elo's formula P = 1/(1+10^-Δ/400) maps the power difference and the success rateI don't know。
its beauty lies in restraint: it does not pretend to know everything, it gives only one long-term strong and weak baseline. in the world cup deal, baseline is key. no baseline alpha, often just noise。
Glicko added uncertainty to Elo. A long-term non-matching team, its scores should not be the same as those of the game。
TrueSkill also introduced the Bayestu model to a multi-person/team rating. The uncertainty is particularly relevant when it comes to national teams: some have been stable for several years, others have changed sharply, some appear to be approaching, and the real confidence zone may be completely different。
Disassembly, the rating model is appropriate to answer three questions: who is the strong team in the market consensus? Which team's strength and weakness are priced by the old reputation? Which team is over-punished by the market because of the small sample? But the rating model cannot be traded alone. It's like a map, not real-time weather。
The scoring model gave maps, but the national team had fewer samples and more noise, and the maps were also distorted by several competitions. The trade in the World Cup is most afraid of treating a victory as a dynasty and a cold door as a collapse. A brake system is also needed next to the map to tell us how much news and fruit should be updated and not how much。
3.3 Bayesian Hierarchical, Brake System in Small Sample World
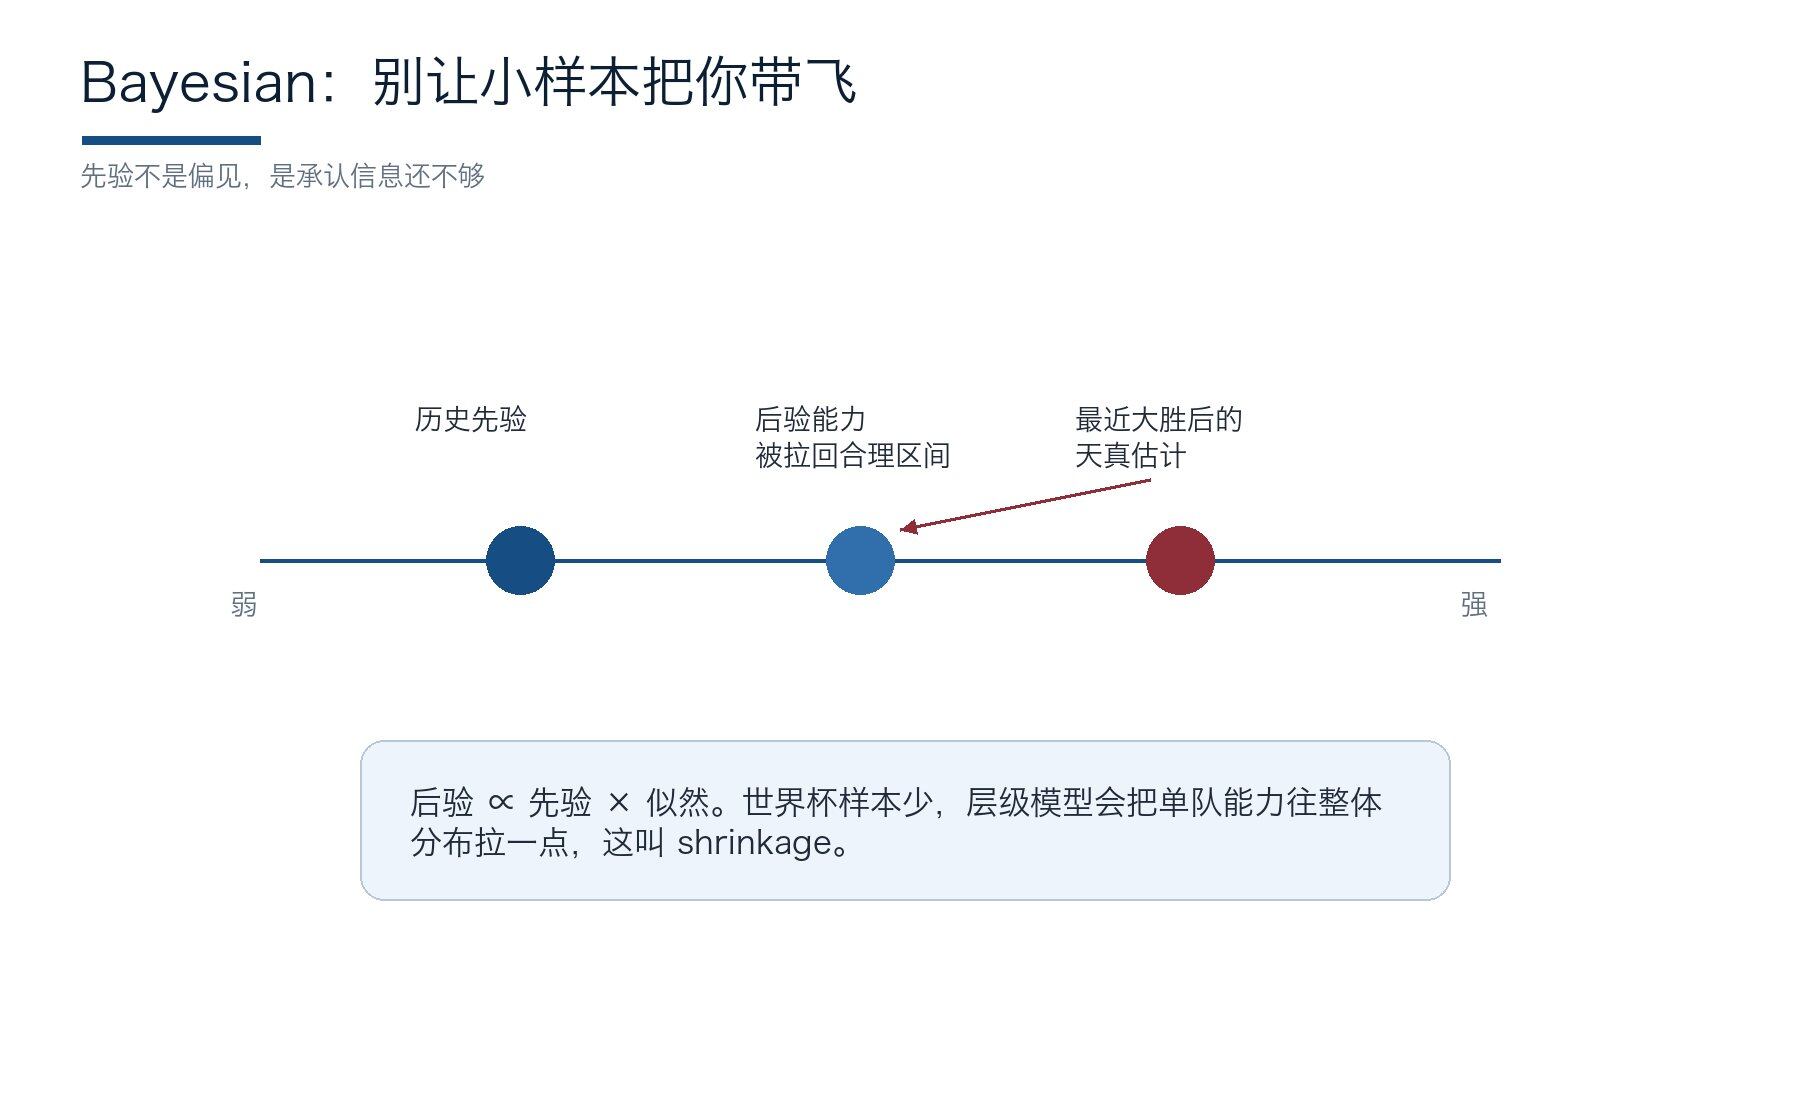 Figure 6: Bayesian shrinkage: A small sample won will be pulled back to a more reasonable posteriori capability range。
Country team data are thin and of poor quality. The pre-selection rivals vary widely, friendships are motivated by different motives, and there are few samples of major competitions. The ability to estimate directly using the last five results, like looking at the lights in the fog, tends to be the trend。
Baio and Blangiardo's Bayesian Hierarchical model offer a more stable language: first acknowledge that we have a priori and then update it with new data; and, at the same time, allow teams the ability to share information in a hierarchical structure, avoiding a single victory or defeat (Baio and Blangiardo)。
The Bayesian core formula can be:Post-test, pre-test, likeI don't know。
The aforethought is not stubborn, nor is it a decree. A priori: France, Brazil, and Argentina could not have lost their long-term capabilities because of a friendship race; it seems to tell you that if the cores continue to fail to create opportunities, they cannot hide forever in the glory of history。
When you really do it, Bayesian thinking is best suited to the news。
- Does the absence of the core front change the long-term ability of the team, or does it affect only one game
- Young mid-guard's error. Is it a power exposure or a single noise
Markets often overreacted in the first hour of news。The Bayesian model doesn't slow you down, it tells you how much to update。
Virtual reference
The Bayesian update can be used:
before the race, you think a team won nine percent. after the core guard was injured, the market hit 6.5%. and if your player-level model thinks his replacement can keep 80 percent of the defense, maybe just 8.1 percent, that's a possible overreaction。
On the other hand, if the absence is the only point of entry, the market may not be enough for one point。
At this point, do not rush to shout “the market is wrong”. Let's start with three things:Which line is affected, how many times, who's the substitute。
i don't know, insidersIA INTELLIGENCE CAN HELP YOU FILTER NEWS, LAUNCH, PRICE CHANGES AND SMART WALLET MOVES IN NATURAL LANGUAGESYour task is to determine how much of this information should be updated a priori, rather than being taken away by the first price line。
Bayes addressed the scale of renewal, but it still needed better observers. The scale was too rough, 1-0 could be either full-scale repression or a reflection; depending on the outcome, traders could easily take luck. So the next microscope is xG: It takes the game back once, so let's see how much process supports the price movement。
3.4 xG, second eyes after score
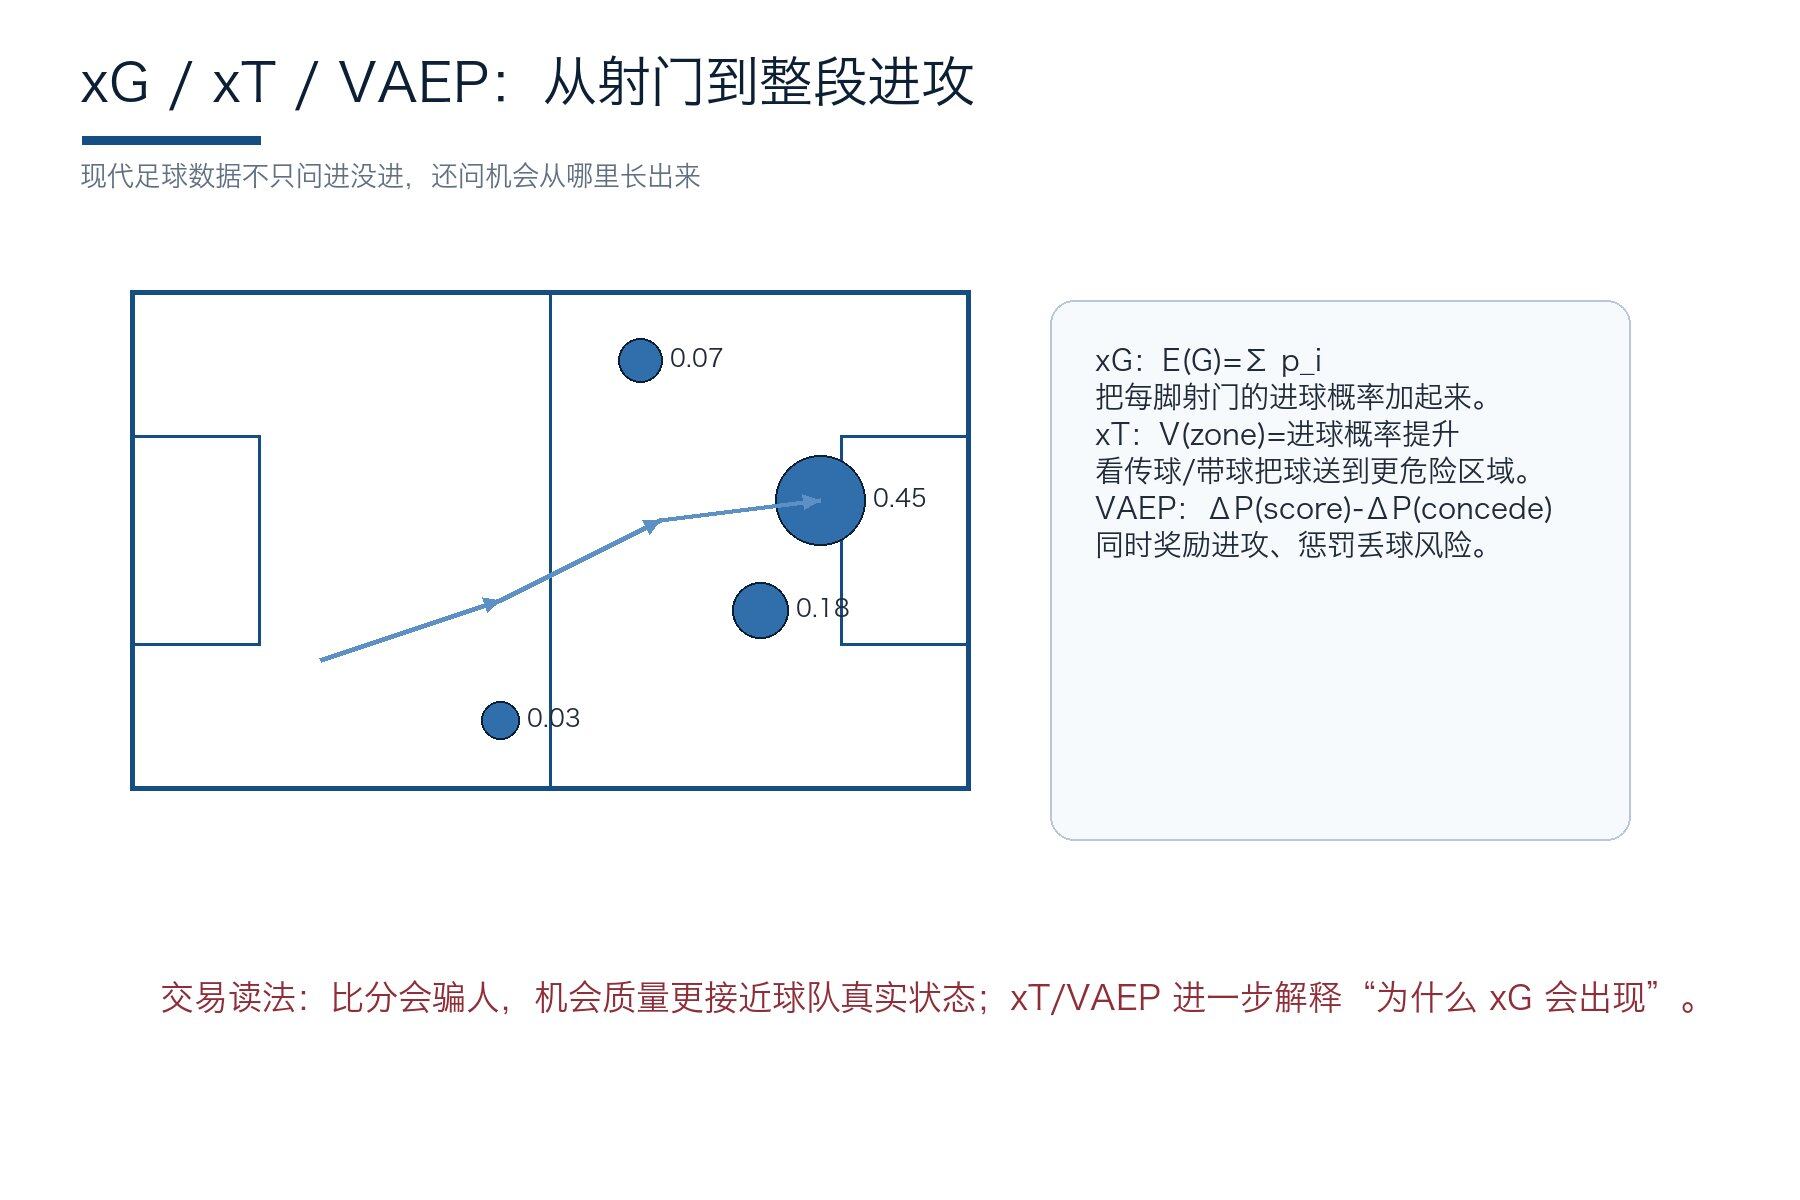
Figure 7: xG / xT / VAEP: From goal shot probability to right and action value。
xG sees every shot as a probability. The close range could be 0.45, the off-limit range could be 0.03. Add all goal-shooting possibilities to a single game and get the total quality of opportunities created by teams. Mead, O'Hare and McMenemy discussed how xG could improve model performance and demonstrate its projected value (Mead, O'Hare, and McMeniemy)。
The score is the result, the xG is the process。
A team of 2-0 wins, which could be a 3.0 xG crush, or a 0.4 xG double-footed fairyball. Dealers tend to take luck when they look only at the score; if they look only at the xG, they may ignore the doorman, the quality of the shooter and the tactical choice. The right thing is for them to interrogate each other。
xG's formula can be written in E(G)=Σp i. It breaks it down into many small probability events. The advantage of doing so is that the noise is spread. The goal of a single field is rare, but the goal is much greater; the position, angle, body part, defensive pressure in the door provides a more subtle texture。
Disassembled action, xG is best suited for "Segregation of process and result". Straight-on-the-post teams are easy to catch up with in the market; unending but stable-to-exceed teams of x-G can be compromised. The World Cup is short, and the deviation will be magnified by public opinion, which is the hotbed of repricing trade。
Virtual reference
This is typical of the reverse process: Team A 2-0 wins, the social media is exaggerating, and the whole scene is only 0.7; Team B 0-1 loses, but has a high-quality opportunity of 2.0 xG and multiple restricted areas. If the next market continues to chase A and B, the model will have the opportunity to get to the opposite side of the narrative。
The operation is simple: after half an hour of the race, only one table is made, with points, xG, non-penalty xG, no-go ball, locator ball xG, red card split. If the outcome is the opposite, then look at the next single market and see if the line market is mispriced. There's no mystery here. It's important not to let the score think for you。
xG saw the shot, but many of the dangers occurred before the shot. Whether or not a team can continue to push the ball into a dangerous area often sends a signal earlier than if it has been fired at one of its sites. And the next step is to push the camera back from the last foot to the entire right-wing chain, and see how xT and VAEP turn pass, carry, and push after oppression into researchable values。
3.5 xT, VAEP and the rights value, not just the last foot
 Figure 7: xG / xT / VAEP: From goal shot probability to right and action value。
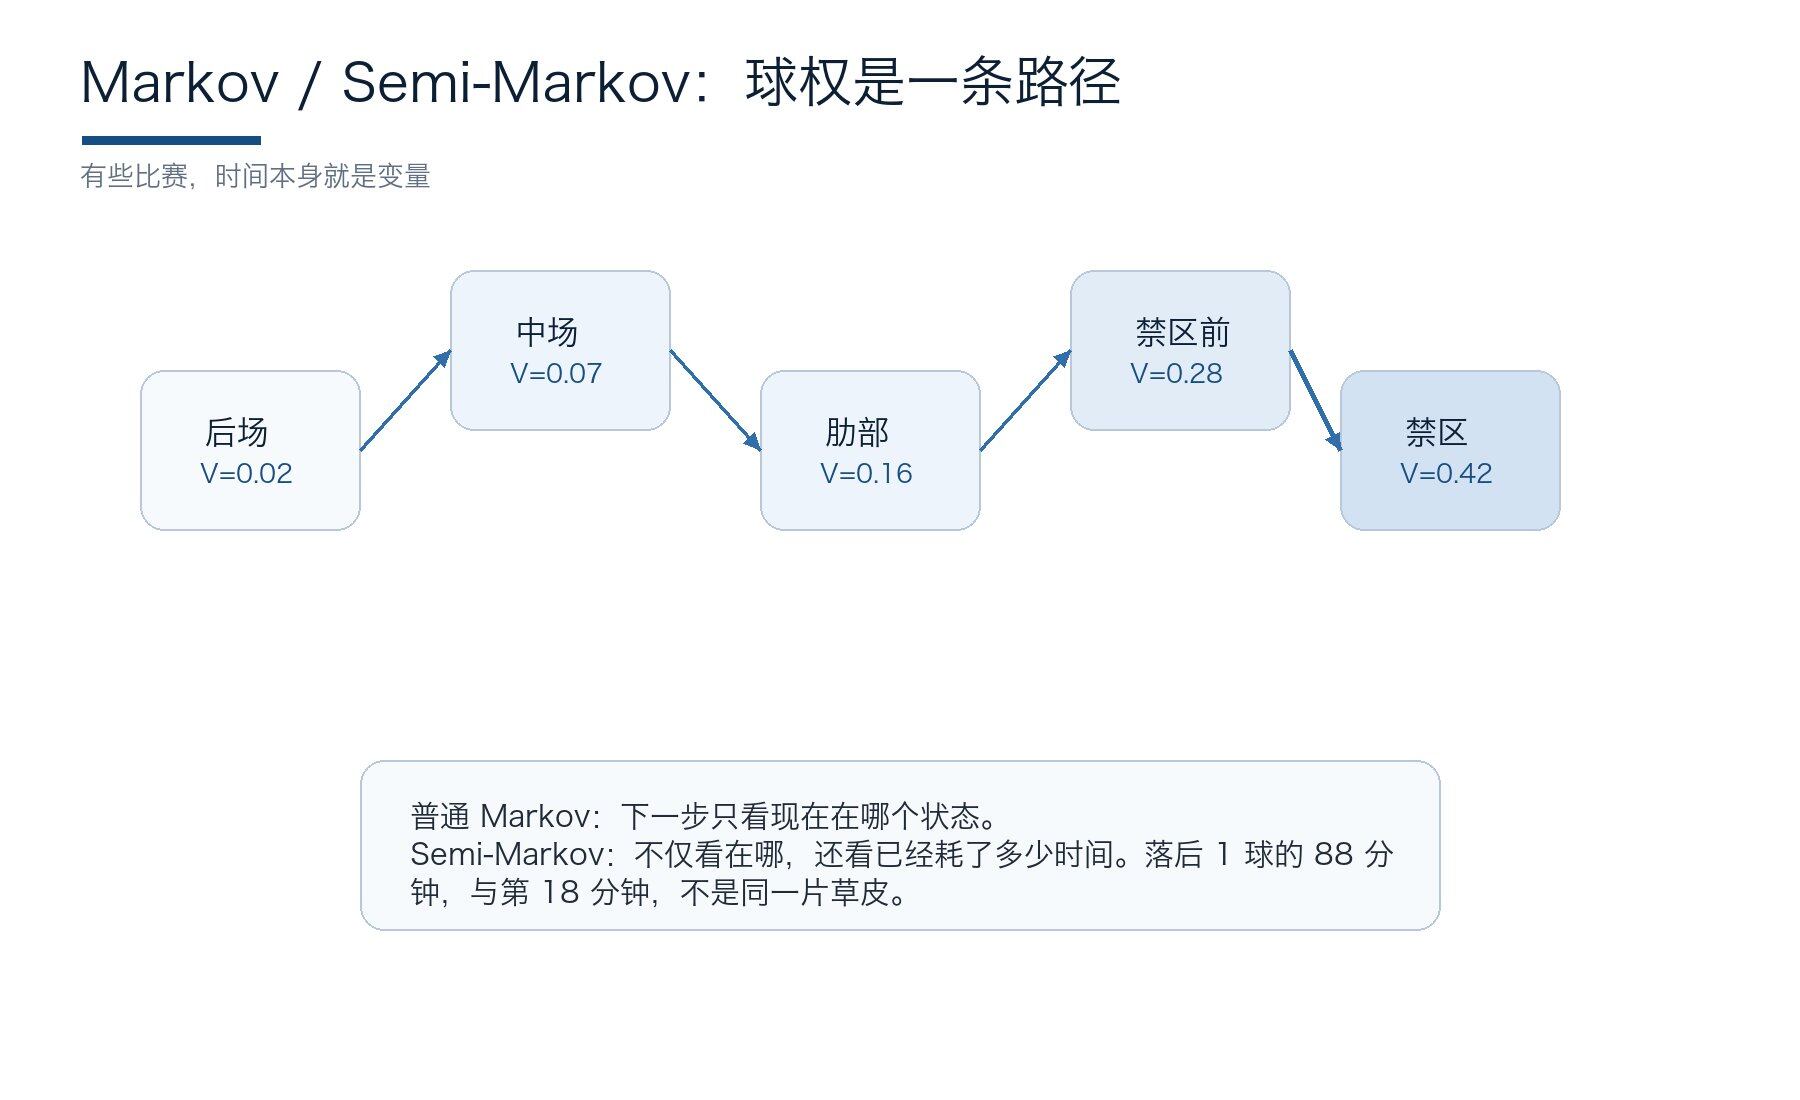 Figure 8: Markov / Semi-Markov: Swap is a probabilistic path with a time structure。
xG just watch the goal, but a lot of real danger has happened before the shot. A straight plug through the middle field, a push from the edge to the ribs at a time, and a transtion formed immediately after a counter-attack could change the chances of a goal, but not necessarily a shot。
Expected Threat (xT) divides the field into areas, each with a threat value. A pass or a carry ball increases the xT if it reaches a more dangerous area. VAEP goes further by measuring the impact of each action on the probability of a score and the probability of a throw. It rewards not only attacks, but also risks。
Recent postsession-value studies continue to advance over time dimensions. Le Coz, Boustaila and Imbach, released early in 2026 in Scientific Reports, Simi-Markov Temporal xT, places action type, location and stay in the same frame, emphasizing that the remaining time will change the right value (Le Coz, Boustaila, and Imbach). This is particularly important for the phase-out: 20 minutes to control the ball push, and 88 minutes to lag, and not the same price。
For real execution, xT/VAEP is appropriate to determine whether a team attack is "long in the right place." Some teams don't explode, but they can continue to push the ball into high-threat areas, and sooner or later they will transform; others shoot more, but mostly at low quality, and markets can easily be deceived by false prosperity if they look at the shots。
When the variables are growing, linear intuition starts to run out. Age, travel, formation, weather, market prices, process data colliding with each other often create non-linear risks. The value of machine learning is not to give you answers, but to help you discover these combinations, but the stronger it is, the more we ask whether it captures the football message or simply looks at the future。
3.6 Machine learning, random forests and Dolores, powerful but most afraid to look at the future
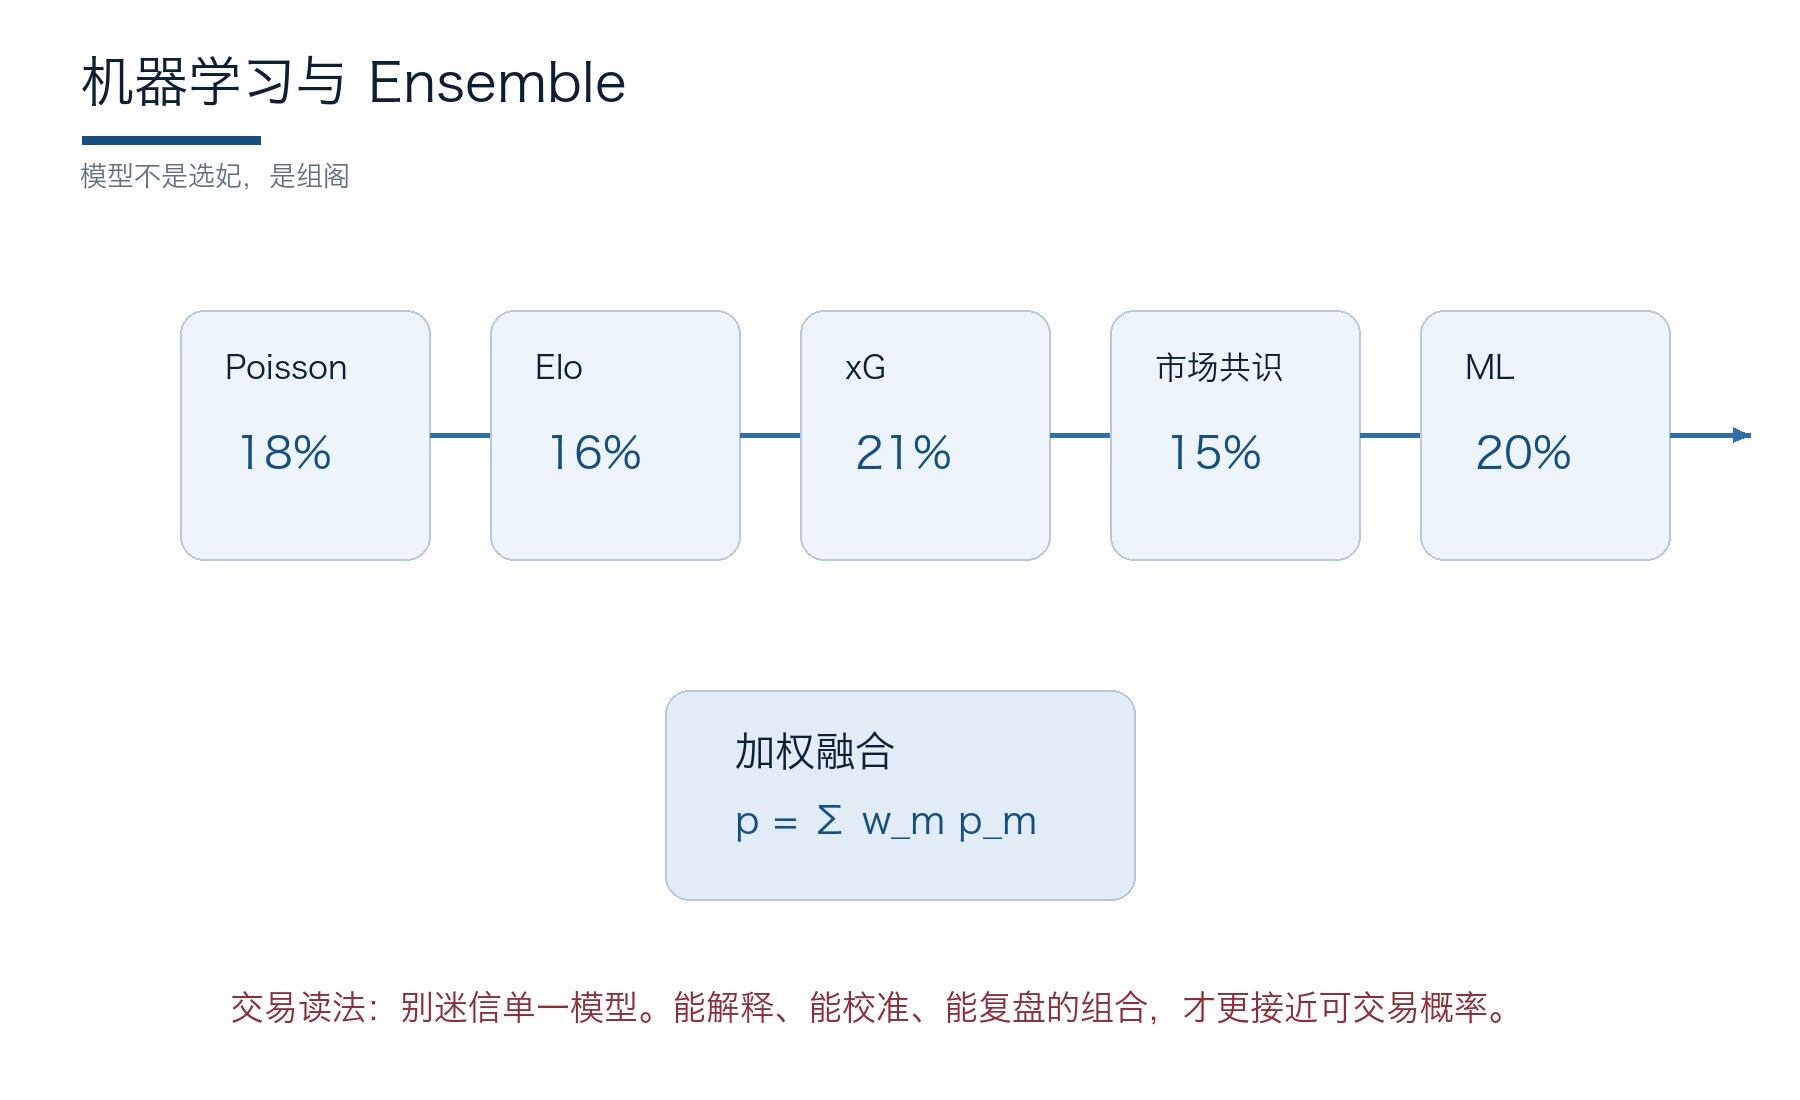 Figure 9: Multi-model integration: interpretable, calibrated, removable combinations are more stable than a single model。
when machines learn to enter football predictions, variable space is opened up significantly. the age of the team, the size of the players, the intensity of the club, the term of the coach, history ranking, the hidden probability of the market, geographic distance, and the density of the course can be put into the model。Groll et al. predict international events using hybrid ranndom forecast and combined with Poisson ranking methods (Groll et al.). In Constantinou, Dolores mixes dynamic racings and Hybrid Bayesian Networks to forecast the results of the competition using cross-country, cross-union data (Constantinou)。
machine learning has the advantage of handling non-linear. one variable does not work alone, but meets another. for example, young formations may not be poor, but risks may rise non-linear when young crowds are inexperienced, wetter and high-pressure. tree models and boosting models are good at capturing this combination。
but machines learn to make two mistakes. the first is the data space. the information that comes to light after any race does not appear in the pre-game prediction. the second is the lack of interpretativeity. the model gives you a 13.7 percent chance of a champion, and if you don't know how it works, you don't know where to update it when the news comes in。
disassembly, machines learn to be a vote for an ensemble, not an encyclical, not a shortcut. it reminds you of non-linear risks, but ultimately leaves the explanatory variable:
- how
- how
- How does the probability change
- Is the market price enough
Virtual reference
Machine learning is best suited to deal with variable touch. For example, the senior mid-career is not a disaster per se; the risks are only suddenly magnified when it encounters high-level oppression, wet and hot weather, short breaks and speed-type edges. Tree models capture such combinations, but traders must pursue them。
IV. Putting probabilities on the market: benchmarks, deals and warehousing
the model only tells you fair p, which is a fair probability estimate。
In reality, market transactions answer another question: This probability is possible at a good price and expressed in a warehouse that will not destroy the account。
4.1 Market consensus and benchmark prices, with no rush to say the market is wrong
Many do models, and the first reaction is to defeat the market. It's a hot gesture, but easy to be arrogant. Leitner, Zeileis and Hornik discussed the prediction of sporting events using races and market consensus; Zeileis et al. World Cup projections also often use price consensus as an important benchmark (Leitner, Zeileis, and Hornik)。The reason is straightforward: market prices are not a one-person view, but a compression of much information, money and risk preferences。
forecasting market prices is also a benchmark. it's not always right, but it's rarely without information. in particular, such a global event of concern as the world cup, open information quickly entered prices. if your model is much different from the market in the long run, don't rush to wonder if you're missing a variable, rather than celebrating the discovery of alpha immediately。
It's more like a trader's gesture to use the market as a baseline and then look for an explanation deviation. The bias must be sourced: the market overtly pursues the planet, underestimating the defensive structure; the market punishes a bad score, ignoring xG; the market looks only at the champion’s probability and does not count the third step; the market price shows a low price, but the depth of the order book is not enough。
when real implementation is done, do not rush to write “i am smarter than the market”. as a form: my p, market bid/ask, edge, probable cause, authentication signal, failure condition. it's only the deviations that can be reset that fit the strategy。
This section is easily misinterpreted. Respect for markets is not the truth; it is more like looking at the weather before going into the mountains. Weather forecasts may be wrong, but you can't pretend it doesn't exist。
If your model and the market are so different, the best first reaction isn't excitementIt's wrong:did i miss the wound? did i miss the path? did i just look at the price? over time, the remaining margin is worth taking seriously。
Virtual reference
respect for markets does not amount to submission to them. one practical process is to write down their own fair p without looking at the price; then look at the market bid/ask; and end with the phrase “where does the margin come from, if any”. if you can't write why, don't trade. the margin must come from what the model can explain: the path, the process, the illness, the motive, the depth of the order book, rather than the phrase “i think the market is undervalued”。
It's also the right way to use smart money to filter signals. Seeing hot wallets is just saying it's worth opening, not that you should. The next step depends on whether the price is still in your zone, whether it is deep enough and whether it has crossed the margin. The tools are responsible for putting the market before you, and the judgement is still to be completed by research。
the market benchmark addresses “whether i am too confident”. but the world cup champion is not a single event, but a whole path tree: the team's ranking changes the opponent, the probability of promotion changes, and the probability of promotion changes the champion's contract. to trade the championship market, we cannot count as one, running the whole race over and over。
Models and market use quick check
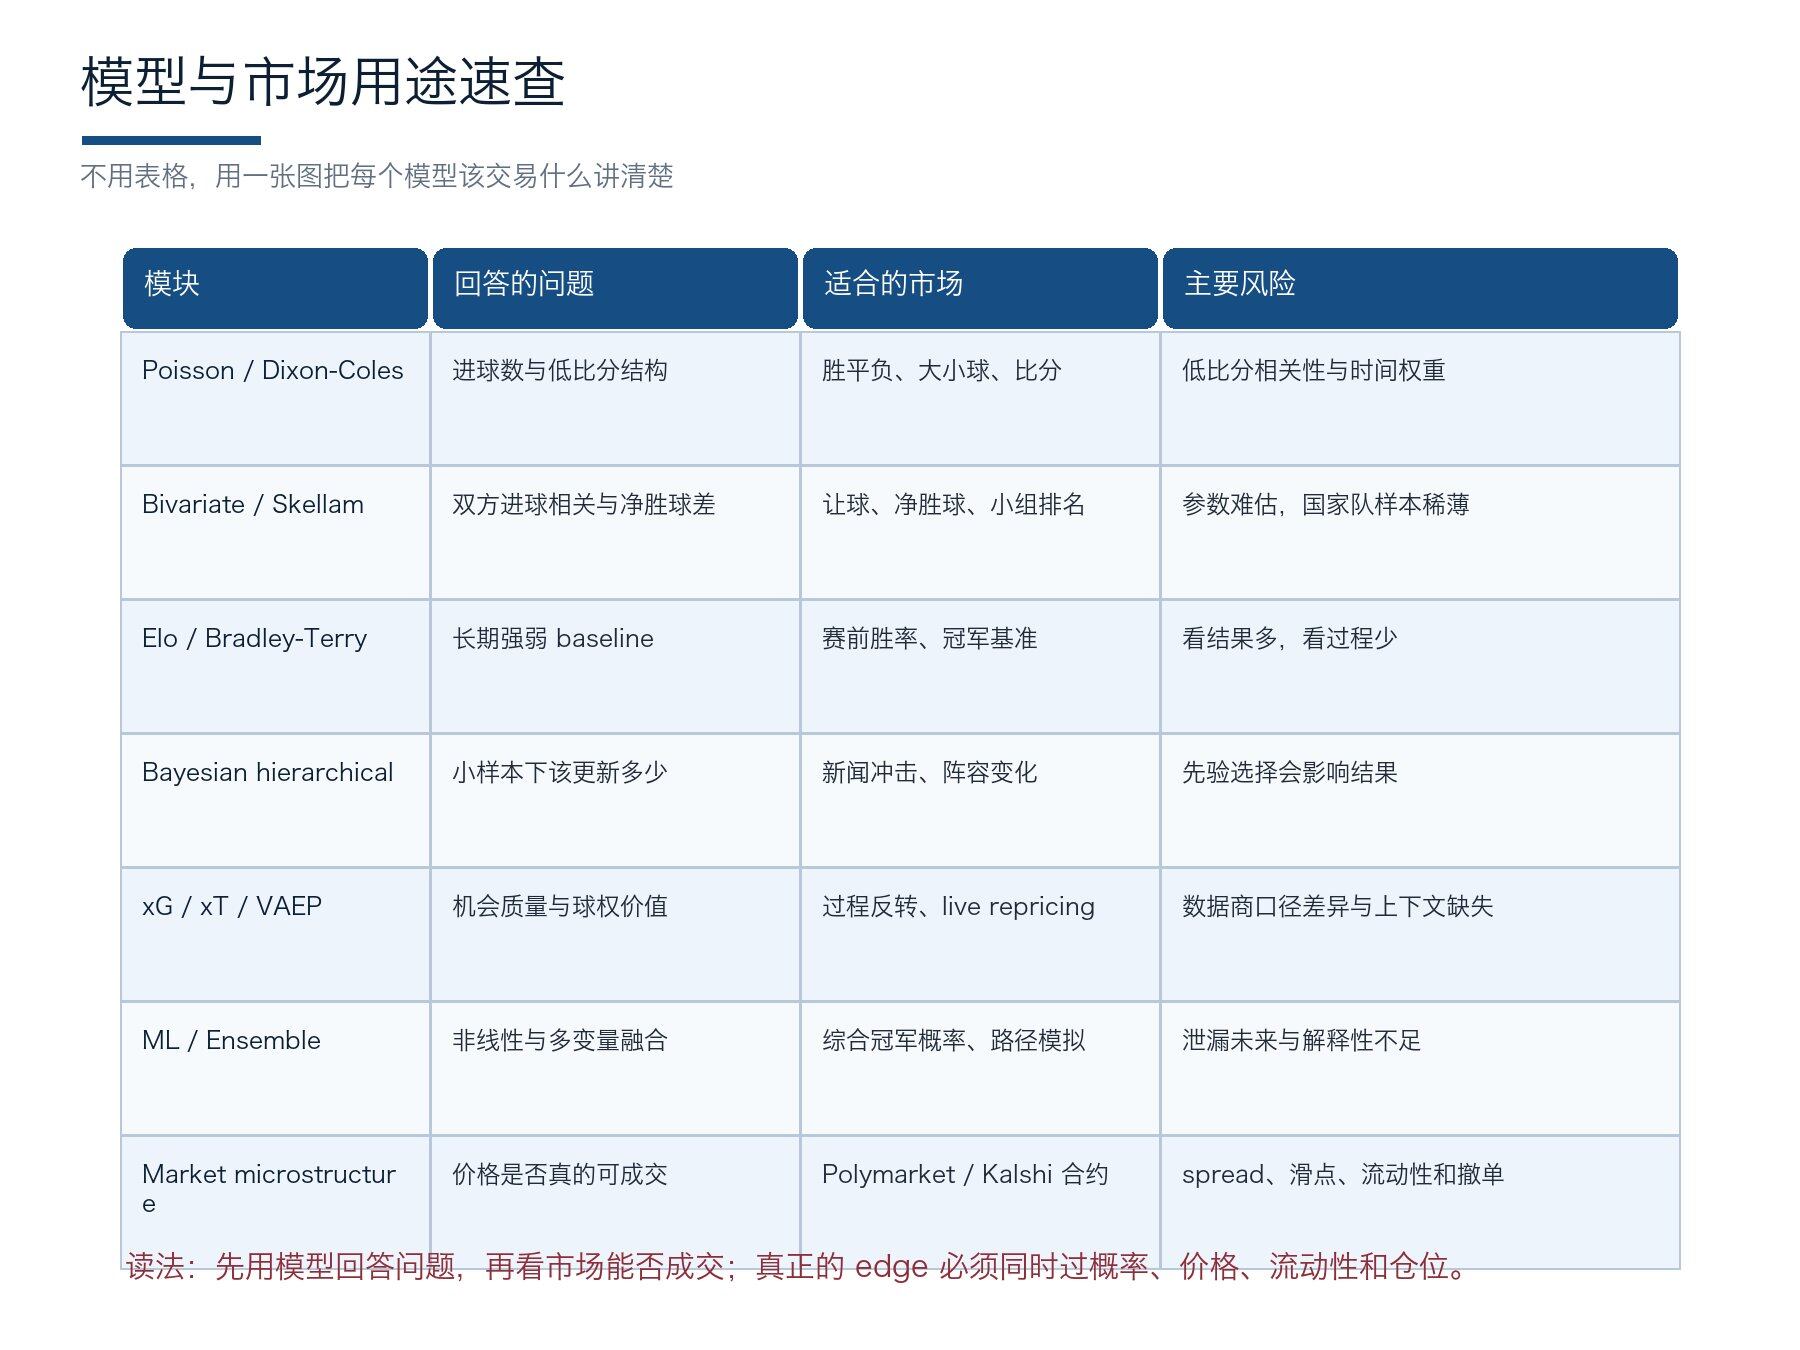 Figure 13: Modelled use quick check: Different models answer different questions and also respond to different markets and risks。
4.2 Monte Carlo, winner's probability comes from path frequency
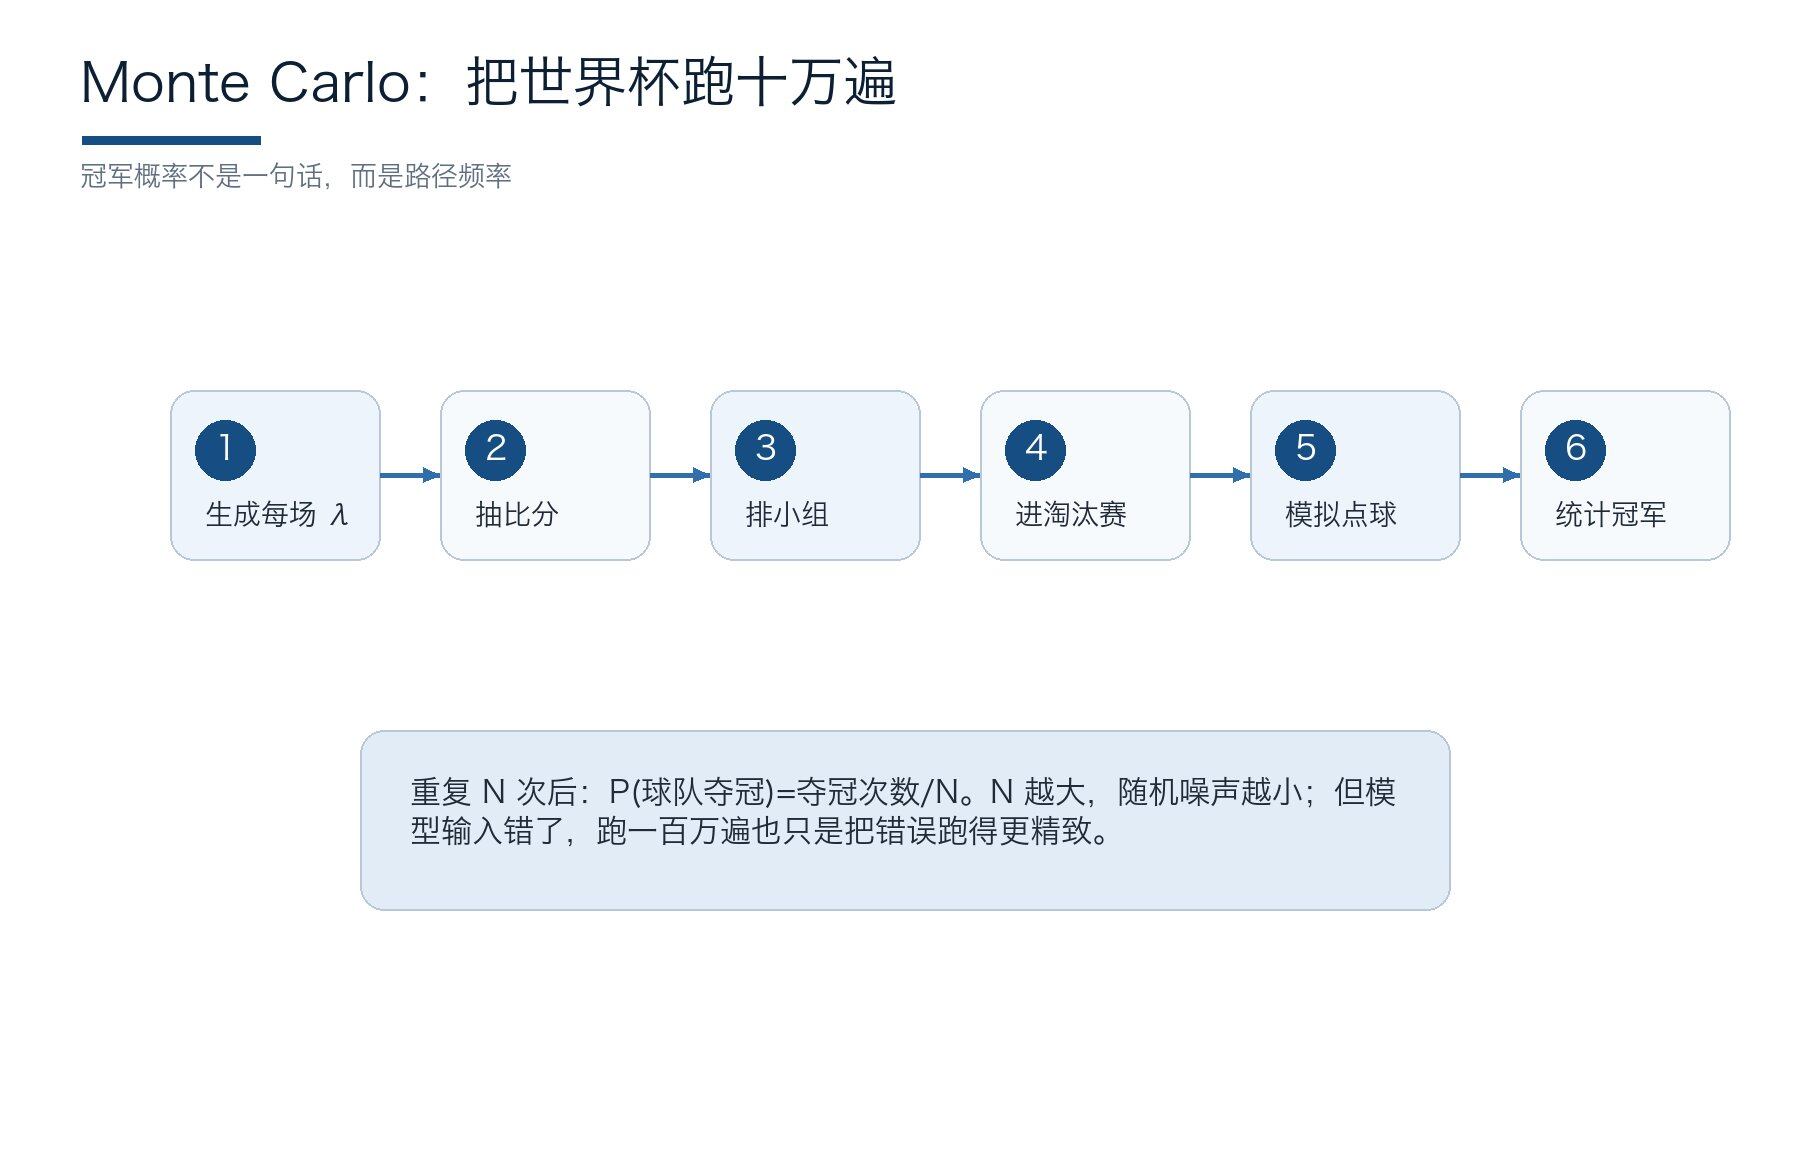 Figure 10: Monte Carlo: Simulation of the entire World Cup, path and champion probability。
The World Cup Champions Market has to simulate the whole game. One-stage models give you the A vs B odds of winning, but the champion's odds need to know who each team might meet from team to final. The Elo-based World Cup model of Gilch and Müller uses a single field to estimate entry into Monte Carlo Simulation and the probability of teams entering different stages (Gilch and Müller)。
Monte Carlo's approach is not unprejudiced: first, to produce a score for each game; secondly, to draw points from the ratio distribution; thirdly, to rank according to the group rules; fourthly, to simulate the phase-out race, time plus and point; fifthly, to repeat 10,000 or 100,000 times; and sixthly, to measure the number of wins per team。
here's the key: the simulation is not to look so quick, but to keep the path. one team is strong, but the semi-district is too difficult, and the chances of champions are underpressed; one team is weak, but the market may underestimate the path. under the third promotion mechanism in 2026, path simulations were more important than in the past, as the same 4 outlines could be of very different value to different sectors。
breaking up action, pre-winner contracts fit for path value track. during the panel, there will be a connection between the promotion contract and the championship contract: a 2-0 event that not only increases the probability that the team will be out of line, but may also change the ranking of the net wins and eliminate the competitors. instead of waiting for the news to tell him that the promotion was in the best position, the best trader recalculated the path immediately after the score had taken place。
The simulation gives you the probability, and the reset tells you if the probability is true。You can run 100,000 times out of the World Cup, but if you never check if 60 percent of the events really happen about 60 percent, the model will become more and more like a confident illusion machine。
So, in the next step, we need to calibrate and rate every prediction back to the record for testing。
4.3 Calibration and scoring, do not cheat on yourself with a hit rate
The cruelest predictor of the market is that it punishes overconfidence. You said that 80% of a team would win and lose; you said 55% of a team would win and lose. Both are wrong, but the former are more expensive. Probability projections cannot be based solely on impact rates, but on calibration。
Brier score (p-o)^2
- p forecast probability
- o results
- As 1
- Do not happen as 0
Log loss is more punitive of self-confidence mistakes. Ranked Production Score (RPS) is often used for orderly multi-classification predictions such as winning or losing, but it is also discussed by scholars about its limitations in football assessments (Wheatcroft)。
calibration is very simple: do you say 60 percent of the events, about 60 percent of the time? if all you have is 70% pick and only 50%, you're not bad luck, you're too confident. if you're all 55% pick and 65% last, you probably underestimate your own edge。
Disassembly, a transaction log must be established. Each record: model p, market q, purchase price, offer price, edge source, news trigger, final result, Brier, proceeds。
i don't know, insidersThe dashboard and AI anent can put orders, price ranges, wallet signals and news updates in the same table, not "predict for you," but make your predictions reset。
next, you know you don't have edge after that and see if you can make a deal. one of the most realistic lessons in the field is to show that the price is not equal to the transaction price; 60 per cent on the page is good, but ask, bid, stepth and slide points will determine how much you really get。
Only through the order book level can the model probability become a physical position。
4.4 Market microstructure, showing prices not equal to tradable prices
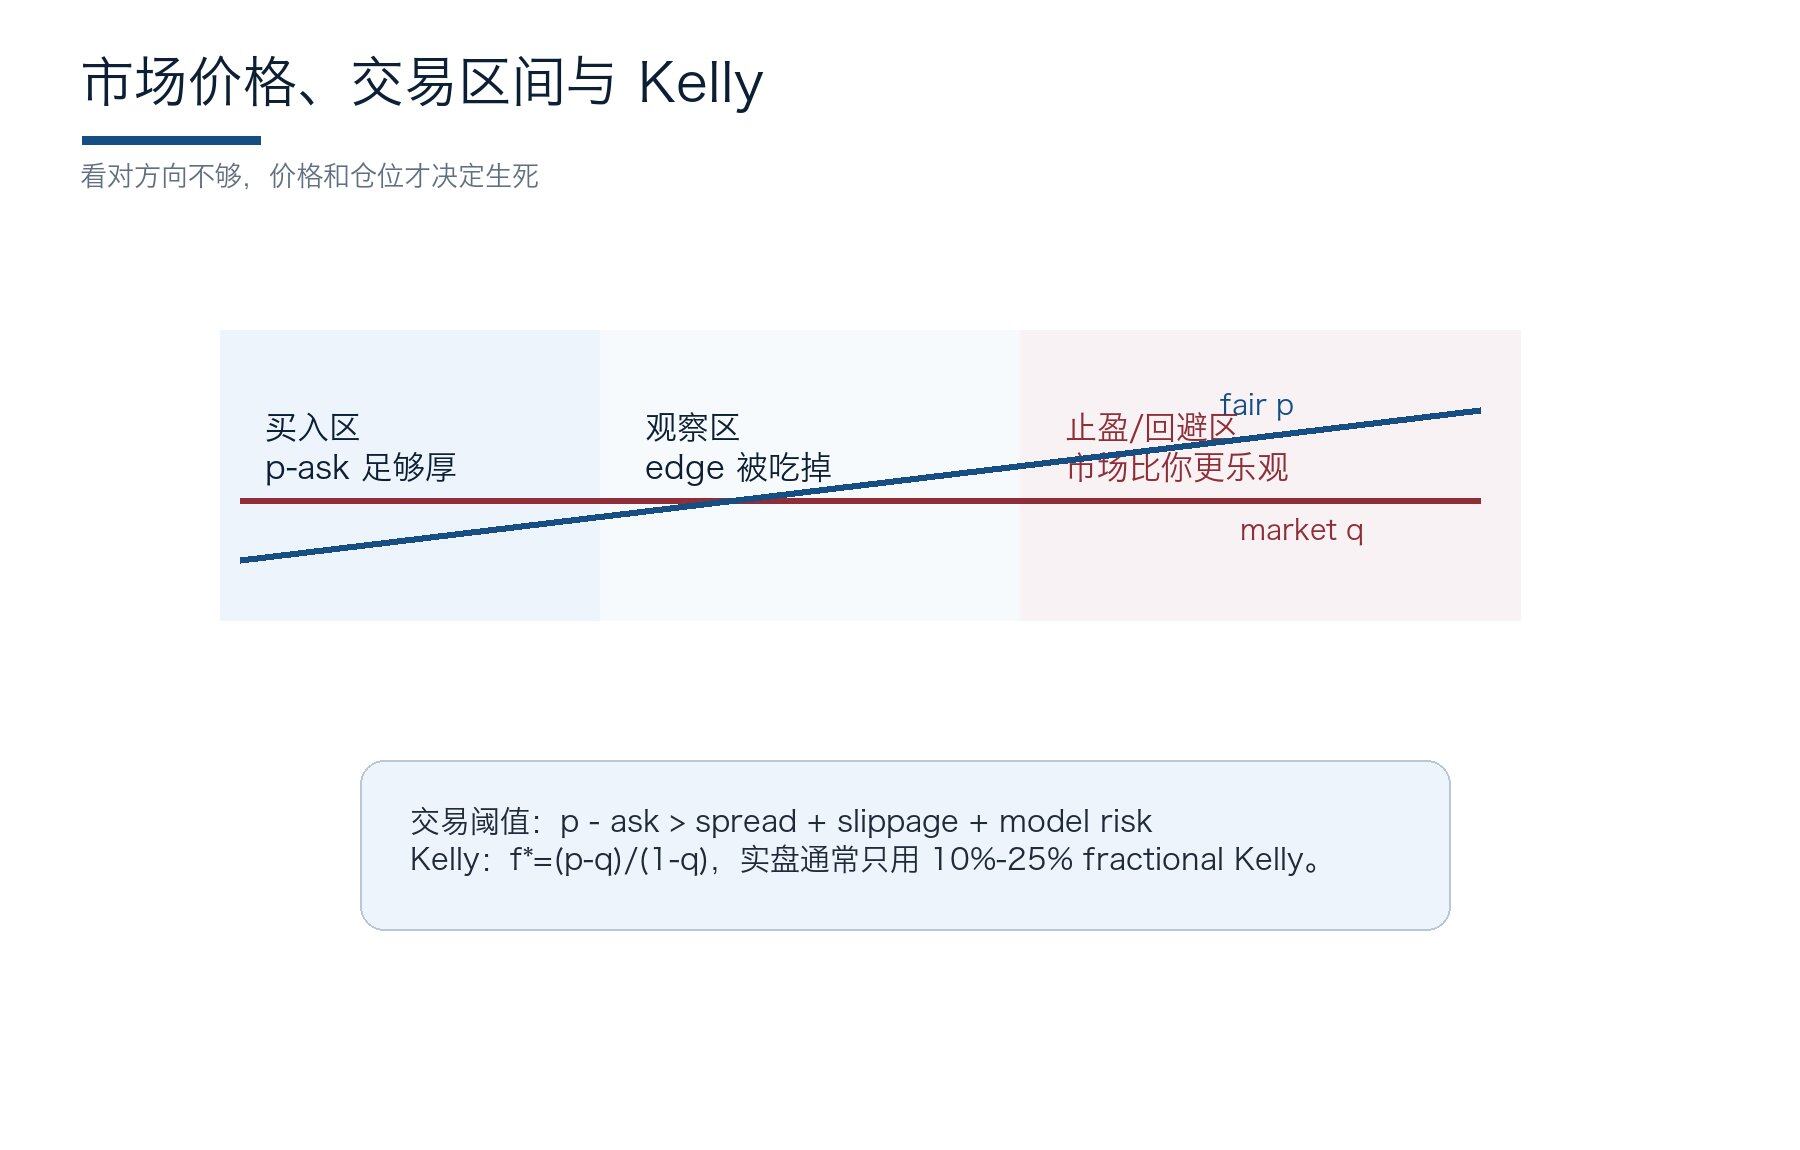 Figure 11: Market prices and Kelly: After looking in the right direction, there are three different doors: prices, slide points and warehouses。
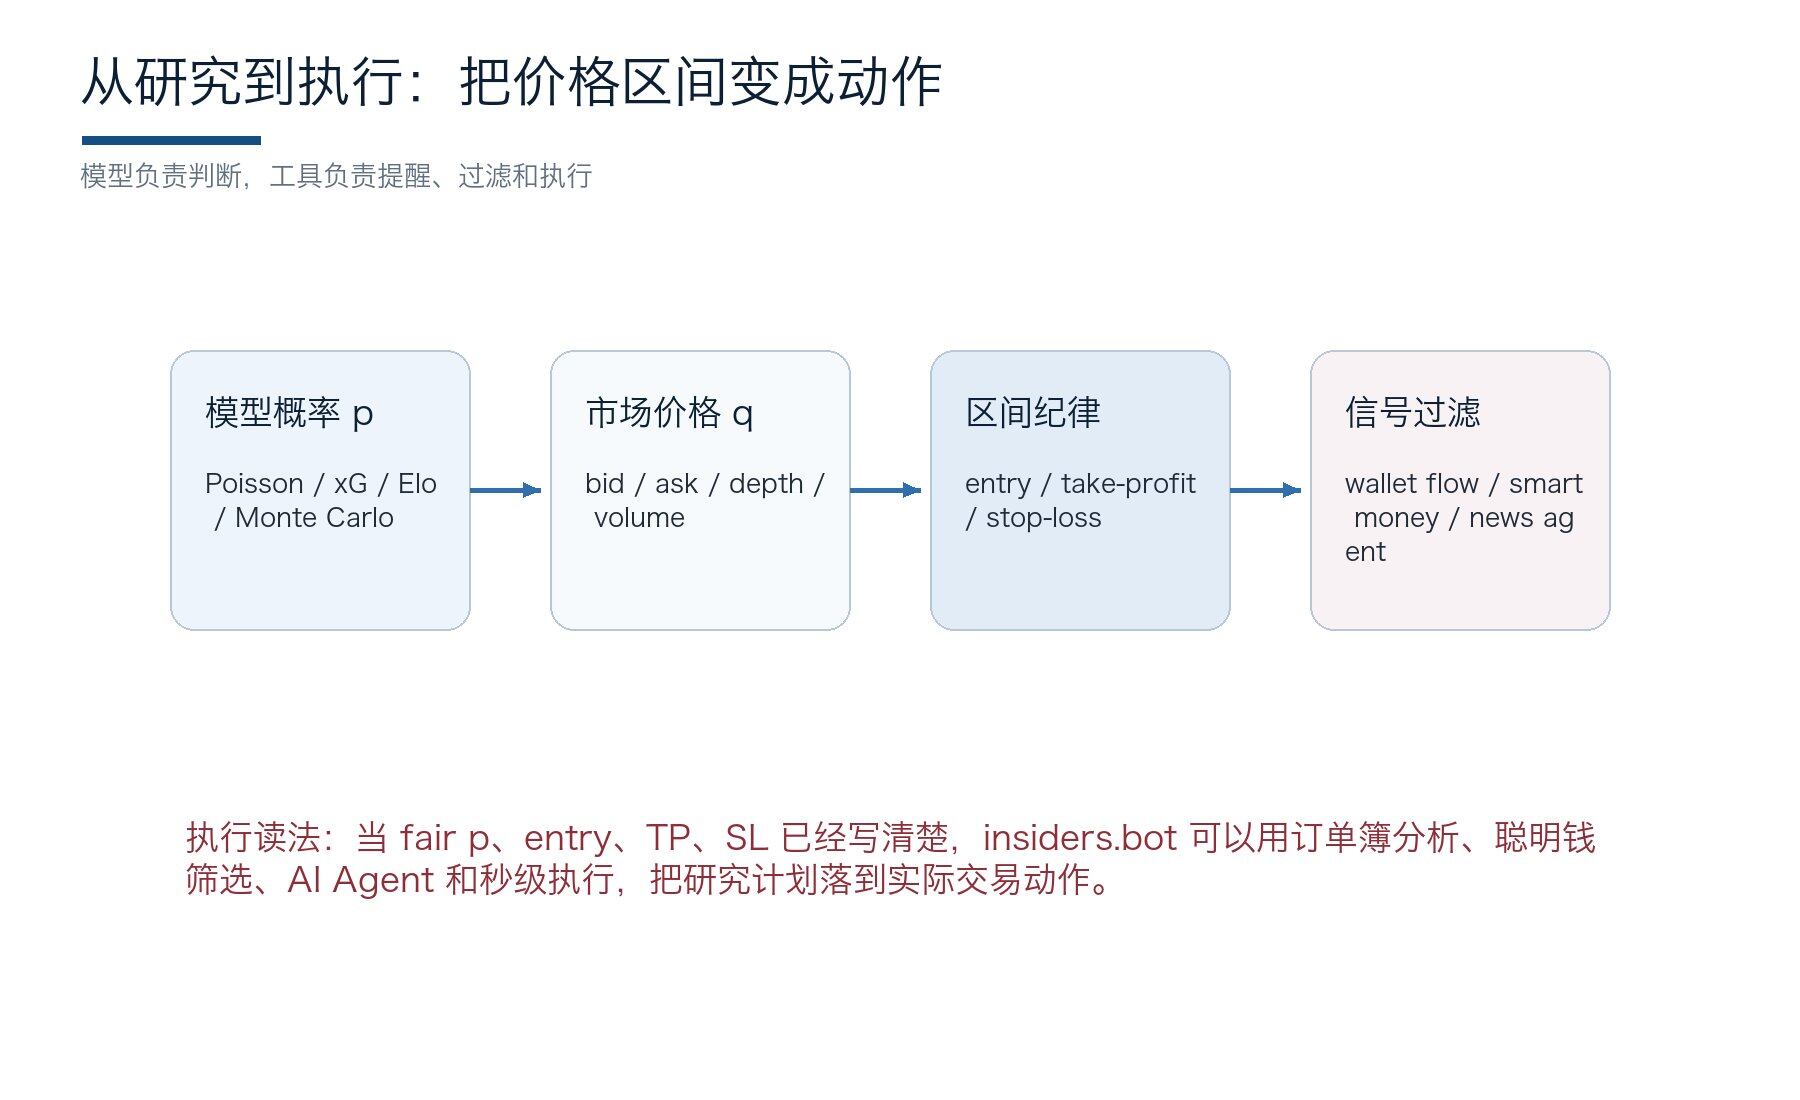 Figure 12: Executive Level:i don't know, insidersSuits the price interval, TP/SL, wallet signal and AI variable update。
In the forecast market, it shows that prices are just a front. The real deal depends on the bid, ask, spread, decth, the trade, the hanging of the withdrawal, the price shock. Polymarket documents indicate that the price may be Bid-ask midpoint; and real buy-in faces ask and sells against Bid (Polymark, “Prices & Orderbook”)。
assuming you think a team is promoted p = 64%, the page shows 60%. looks like four points edge. but if ask is 63%, and it's shallow, you get a little price slide to 66%, and the deal is not as pretty as it looks. conversely, a market showing 58 per cent, ask 59 per cent, depth and stability of orders may be more suitable for enforcement。
In the world of CLOB, the life cycle of orders and the depth of the market dictates that what you get is not theoretical gains, but real gains. Polymarket's order is a limit order system, the details of which affect the outcome (Polymarket, “Order Lifecile”). During the World Cup, changes in the initials, injuries, red cards, and netter balls will make the order book thinner. The most common way to lose is to look in the right direction and take the wrong price。
disassembly, to write the transaction into a compartment rather than a view: less than 14 percent of the warehouse, 14-17 percent of the observation, 20 percent of the profit and more, and break the damage。
Herei don't know, insidersTP/SL, MULTI-MARKET SURVEILLANCE AND SMART SIGNALS ARE SUITABLE FOR USE: IT'S NOT A TRADE STRATEGY FOR YOU, IT'S A TRADE STRATEGY FOR YOU WHEN PRICES MOVE FAST。
a lot of people who have just entered the field think of the forecast market as a button: buy if you can, sell if you can. the real deal is more like crossing a bridge. this side of the bridge is your probability, and the end of the bridge is a bargain price, with spreads, slide points, depth and withdrawal orders。
So the order book is not something for a senior player, but a basic reality check. A model is so beautiful that if it cannot be bought at the right price, it is not a trade for the time being, but a point of view。
Virtual reference
order book case: you figure out a team lined up by 60% of the pagelooks like there's four spots. but the real book of orders may be bad 58, ask 63, and only very small depth on 63。
as soon as you buy it, the average price is 65, edge disappears. in turn, another market page shows 61, but ask 61.5, thick, attached, stable, is more suitable for implementation。
So you have to write three lines each time you write down:
- i'm willing to buy whatever price, up to how much, and where does the price indicate that thesis has cashed or failed。
- TP/SL IS USEFUL HERE, NOT BECAUSE IT'S AMAZING, BUT BECAUSE THE PRICE OF THE WORLD CUP IS ALWAYS BEATING IN THE MOMENT WHEN IT STARTS, THE RED CARD, THE HOMOGENEITY CHANGES。
- The advance writing of traffic and loss into the system is much more reliable than on-site。
The deal was settled, and the final position was left. Look in the right direction, it's just a ticket. This low-level, high-profile, volatile market of the World Cup makes it easier to put a 3-point Edge into 30-point emotional positions, so we have to talk about Kelly and half Kelly。
4.5 Kelly, half Kelly and World Cup space
 Figure 11: Market prices and Kelly: After looking in the right direction, there are three different doors: prices, slide points and warehouses。
The slot decides if you can survive the finals. A simplified two-dollar contract, Kelly, can be written in f*=(p-q)/(1-q). P is your real probability estimate, q is buying price. If p=0.18,q=0.14, full Kelly is about 4.65%。Not much on paper, but it's already radical。
Football models are very different, with fewer samples from the World Cup. Full Kelly assumes your p is accurate, but in reality p may be wrong 3-5 percentage points. An 18% vs 14% beautiful Edge, if it's true p only 15%, the slot will turn from offensive to self-inflicted。
A more stable approachokayI don't know. Using 10-25% Kelly to match the single market ceiling, the unit-related warehouse ceiling, the same route risk cap. For example, the French champion, the French finalist, and the French team first, which is essentially the same group of risk exposures, should not be seen as three separate independent deals。
disassembly, the world cup can be divided into four categories: long horizon before the race, small slot feeding paths; group race repricing, medium slot eating poor information; phase-out single field, low slot control tail; arbitrage/shock, depending on liquidity. a truly mature trader would not have to wait indefinitely for “good looking”。
Virtual reference
Silo: You buy a team champion at 0.14, model fair p=0.18. Full Kelly would give a seemingly rational slot, but the World Cup model could easily eat three points. If the real p is only 0.15, the deal goes from advantage to thin ice. A more stable approach is 10-25% Kelly, superseding single teams, single paths and single market ceilings。
If you buy the same team of champions, finals, first team and core team gold boots, it's not four separate opportunities, but a set of highly related risks。
i don't know, insidersThe self-defined screening and hold view is suitable for checking this: are you dispersing or buying the same car four tickets。
Theory part comes down here. Now we're going to put these models in the World Cup scene and see how they become real. The first case is the wrong price for the core path in 2026: instead of simply asking whether a team is strong or not, the road to a champion suddenly becomes light。
V. World Cup trading cases: from models to actions
Here's the more practical part. In each case, the reader was not asked to copy the numbers, but to learn to translate “what happened” into “what changed the probability and which market might not have changed”。
5.1 World Cup Specific Strategy 1, Wrong Path Price
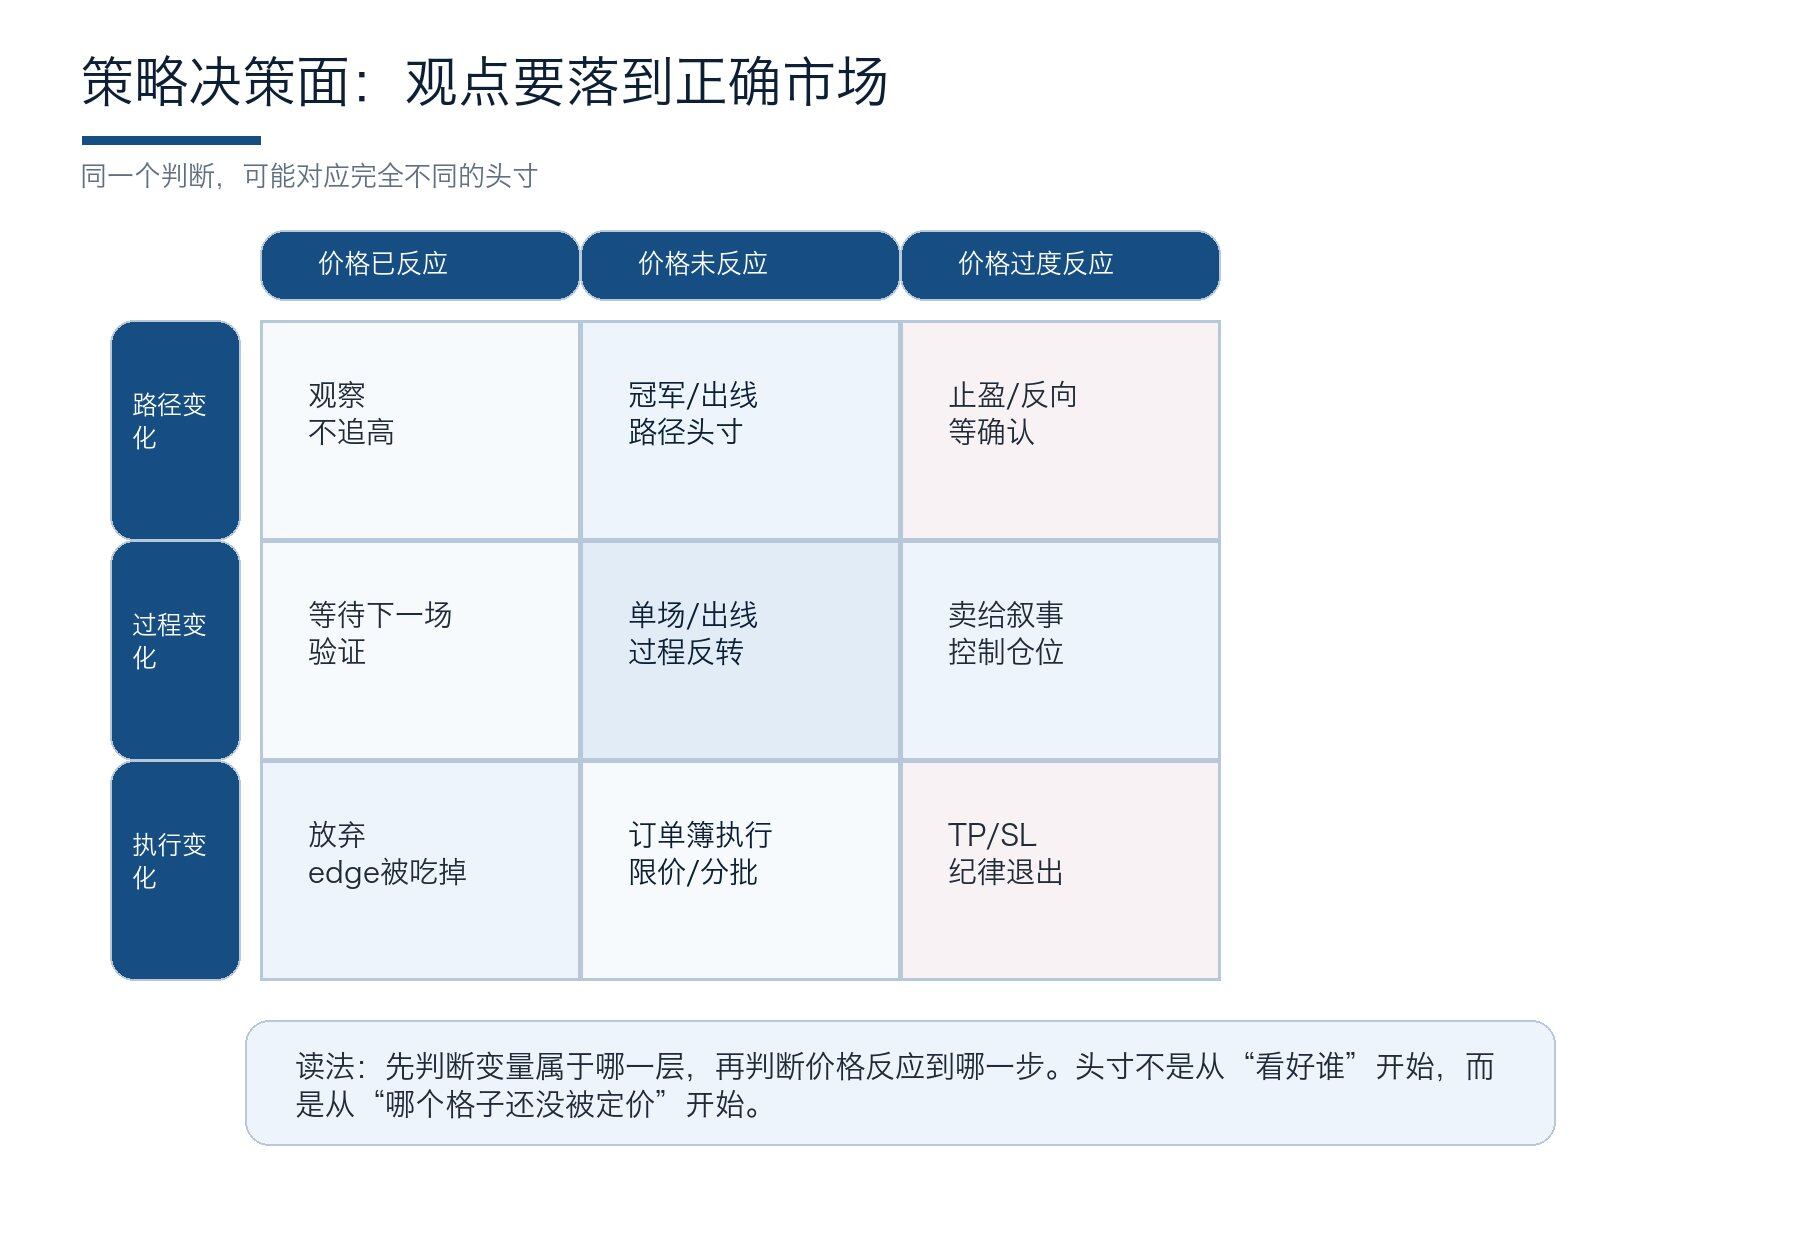 figure 17: strategic decision-making: locate edge sources before judging whether prices are responding。
The wrong path price is the most important strategy in 2026. The market prefers to give the champions the name of the team, but the game will send the team to different half-zones。IF A TRADITIONAL TEAM ENTERS THE SECOND HALF OF THE DEAD, ITS CHAMPION, THE EV, IS LIKELY TO DECLINE SIGNIFICANTLY; IF A SECOND TEAM AVOIDS THE TWO HOT SPOTS, THE CHANCES OF WINNING A CROWN MAY BE UNDERESTIMATED。
Operationally, Monte Carlo is used to generate the probability of each team ' s pre-race path: first, second and third promotions for teams, 16 distributions for powerful rivals, and distributions for eight. And then you compare it with the winning market price. If the price of a team of champions remains the same, but the path improves significantly, there may be a point of purchase。
example: first champion of a team, fair p=5%, market 4.2%. after the first round, it won the ball and the same group went cold. after the model was updated, the model fair p = 7.4 per cent and the market reached only 5.2 per cent. and at this point, edge didn't come from "it won a fight," but from the half-zone the path was reopened. there is a trading window if the price remains at the level of a ratio news。
on implementation, the wrong path has to be priced fast. after the team game, everyone will see the blacket, edge will be eaten. it's better to simulate the score before the third round begins, knowing in advance which scorelines will trigger the re-evaluation of the path。
The wrong price is important because it's not like emotional news. Everyone will see who wins, but not everyone will immediately recalculate who it might meet in the next round, how much has changed in the half-zone, and how many hills are missing in the champion's path。
This is also the most interesting place for predicting markets: Sometimes you don't trade for the team to get stronger, but the world line gets lighter。
Virtual reference
case of mispriced path: a pre-team champion fair p=5%, market 4.2%. first round it's 2-0 wins, same group 1 seed goes cold. after the model was updated, its team's first probability rose from 31 per cent to 52 per cent, and the potential 16 strong rivals became significantly weaker, with the champion fair p to 7.3 per cent. if the market reaches only 5.1 per cent, the opportunity comes from a path, not from a “winner”。
on implementation, the trigger conditions are written in advance: if the team wins and the team is too hot, the champion fair p is recalculated; if the team wins more than two goals, the net win scenario is recalculated; if the market price exceeds 7 per cent, not pursued。
Usei don't know, insidersthe top function (the nail-like icon) allows these markets to be placed in a watchlist with a 24-hour hot market and smart money alert, but the entry line still has to follow its own fair p。
The path explains the entire race, and the process reverses the pricing after a single field. Markets are often held in symmetry, 2-0 are written in a state of fire, 0-1 is written as impotent; but the position should follow the quality of the opportunity, not the title after the match. We'll take the score and the process apart in the next section。
5.2 World Cup Specific Strategy II, Reverse Process
Process reverse transactions, split from xG to ratio. The short World Cup is very easy to create illusions: one team, 2-0 wins, the media says it's hot; the other team, 0-1, loses, public opinion says it's weak. The model asks: Does the quality of opportunity support the story
If the winning team xG is only 0.6, and the opponent xG 1.4, it's just a long shot and a door to score, the market is dangerous. If the losing team xG 2.1, the no-go touch and high-quality goal are stable, it is only the end of the gap, and the next price may be better。
Operationally, 30 minutes after the game is created: score, xG, non-penalty xG, shot Quality, big chance, set-piece xG, red card split, rival strength. And then we're going to limit each team's renewal to a reasonable range, so we don't have to be towed in one field。
Such strategies are suitable for the second round of the group race. After the first round, the market was most vulnerable to a split; the third round was distorted by the motivation for promotion. Prior to the second round, process data had a strong interpretive effect on the next single and offline market。
Virtual reference
Process reverse transactions are not necessarily done on the same day. Most of the time, the best prices appear after the fermentation of public opinion in 6-18 hours. The team that wins the ball, but the team that loses the ball, and the team that loses the game, will continue to lose. You're gonna have to wait for the mood to push the price away and then you're gonna use the model to catch it。
In practical terms, candidates are divided into three categories: good results, good processes, usually not cheap; good results, bad processes, ready to sell to emotions; bad results, good processes, ready to go to the next market or buy points。Ifi don't know, insidersSmart money signals show that professional wallets do not follow up results, but rather are in low-suction teams, which can serve as a reminder for further research。
Process data are critical, but the World Cup is not an ordinary league. In the second half of the group, teams do not necessarily seek maximum success, but choose between points, net wins, third thresholds and rotation risks. In other words, the target function of the model changes with the game system and the position shifts from simple strength to weakness to motivation and path。
5.3 World Cup Specific Strategy III: Motives and Net Winners Ball
The World Cup is not a league, and the goal of the team changes with the score sheet. In the third round of the group race, the motive is the variable most easily missed by ordinary models. A team that is out of line may rotate; a team that needs a net win may still be under pressure; and a team that can move to a level is willing to drag the game into a low-risk area。
The third promotion mechanism in 2026 added value to the net win. In comparison with the third place, the net wins and the number of hits may determine life and death. One team leads the weak brigade 2 and continues to attack after it is no longer just coach style, but path gain。
Operationally, create an incentive table before the third round: current score, net goal, goal, possible ranking, third threshold for other groups, flat/minus/great win EV. Then turn the motive into an adjustment. For example, the team that has to win the 2 ball, the offensive, the uptight, the defensive, the uptight, the uptight, because the pressure will give the opponent space to fight back。
get in the deal, motive strategy fits the ball, lets the ball, the exact score and the live trade. the champion contract is slow and one-time response is fastPasswww.insiders.botThe AI anent with smart money signals can automatically translate the scale and real-time score into incentive alert, thereby reducing the probability of artificial error。
Virtual reference
MOTIVATION: TEAM 3, TEAM A 6, IS OUT, TEAM B 3 MUST WIN, AND ANOTHER TIE WILL PUT TEAM B UNDER PRESSURE. THE NORMAL MODEL, WHICH LOOKS ONLY AT STRENGTHS AND WEAKNESSES, MAY STILL GIVE TEAM A A HIGH MARGIN OF SUCCESS; THE TRADING MODEL WILL PLACE ROTATION, A LEVELLING OFF, A NET GOAL AND A REAL-TIME RATIO OF THE GROUP。
This type of transaction is most likely to be miscalculated. It allows AI Agent to make a summary of the points, net winnings, yellow cards, and the real-time comparison of the same group before you judge whether the market has been priced. If you want to live a transaction, seconds execution and TP/SL can reduce missed windows, but do not let speed replace judgement. First, we know that we are trading in “changes of motivation”, then we talk about implementation。
Motion decides how to kick in 90 minutes, and pointer decides who can take the tail risk in 90 minutes. In the phase-out game, the difference between the two sets of routine time may not be significant, and the real price gap will be hidden in the doorman, pointer depth and psychological pressure. In the next section, we separate this tail risk。
5.4 World Cup Specific Strategy 4, Point Ball and Door End Risk
The phase-out model can't only predict 90 minutes. Regular time, extra time, spotball are three different games. The strength of the team in 90 minutes is clear, not the point-to-play advantage。
Pointing capabilities include the depth of the main penaltyr, the quality of the door, psychological stress, historical samples and the availability of specialized preparation. Samples are rare and cannot be superstitious about historical points, but cannot be completely ignored. Post-shot xG performance by door generals, high arms movements, and the direction of rescue will affect the tail。
OPERATIONALLY, THE PHASE-OUT MODEL CAN BE BROKEN DOWN: P (90 MINUTES WIN) + P (90 MINUTES FLAT) X [P (PLUS TIME WIN) + P (PLUS TIME WIN) X P (POINT WIN)]. THIS FORMULA SEEMS CUMBERSOME, BUT IT EXPLAINS WHY SOME OF THE DEFENSIVE TEAMS ARE MORE VALUABLE THAN CONVENTIONAL MODELS。
disassembly, if the market were to offer promotions at 90 minutes of strength, underestimating the ability of the defense team to drag in points, it could appear. but the slots are smaller, because the point ball is the tail, not the certainty advantage。
Virtual reference
the end-of-the-ball case: the 90-minute knockout team is close, but one team is going to be strong, the pointer is going to be deep, and the other team is going to be hurt. the conventional win-negative model may be given only 50-50, but the promotion market should be given an additional layer at the point-of-ball stage. this edge is rarely as big as deciding the champion market, but it may affect single-time promotions, accurate scores and the relevant additional markets。
Operationally, don't just search for "who points the ball." It is important to have the key players, the top three players, the fourth and fifth players, the replacement players, the stress, the credibility of historical samples. The sample is small, so the space is small; but in the same-price market, the tail details often determine which side is more valuable。
There's a strategy bank, and there's time to move forward. The real good trade in the World Cup is not the beginning of the search for data, but the 60 days before the race: which teams are worth looking at, which variables are the most sensitive and which markets may take your view. You only know where you're going to look when the bottom figure starts。
Five-five days before the race, 60 days before the World Cup. Figure
before the race, the most taboo thing is to ask who wins. the correct order should be slower: first create a baseline for each team, then establish a path for each team, then give an estimate of the value of each path, and finally look at market prices. without it, all news would be critical; with it, the news would be more important。
The first step is team strength. An initial rating for each team was given using Elo, FIFA Ranking, market-implied probability, the last two years of official competitions, the most recent 12-24 games xG/xGA, the time of appearance and the history of injuries at the Player Club. This rating is not intended to show precision, but rather to avoid being taken away by narratives. A strong team should not fall into second class immediately; a weak team should be cold and should not go straight to the top。
the second step is the group structure. the drawing of lots is not simple for each of the four teams, and it determines whether the strong team needs to win, whether the weak team has room for peace, and whether the second team has the first-ever interest. under the third promotion mechanism in 2026, the third value of the panel was simulated separately. the third in some groups may be promising, while the third in others may have to get 4 points to feel safe。
the third step is the half-sector path. the probability of champions is often not the highest, but the highest multiplier of strength and path. if one team is number four, but avoids the first and second hots until the semi-finals, it may be lower than path-adjusted fair value. the best deal before the race is often not the hottest, but the second-line team whose market does not fully understand the path。
the fourth step is to create a watchlist. don't try to trade all the teams. the 48 sub-units are divided into four categories: a core force, a road value team, an overrated narrative team, and an under-mobility team. only the first two categories are found, the third category is found to be sold or avoided, and the fourth category only observes non-heaviness. the world cup is not an exam. it does not have to answer every question。
once the bottom map is ready, the news will be in place. news is neither noise nor order, but a set of messages that need to be translated into parameters. the absence of a core player, anomalous training, and a change in the structure of a warm-up competition should not directly trigger the order, but should first enter the model and change the length, path probability or position limit。
5.6 14 days before the race, news is not news, news is parameter change
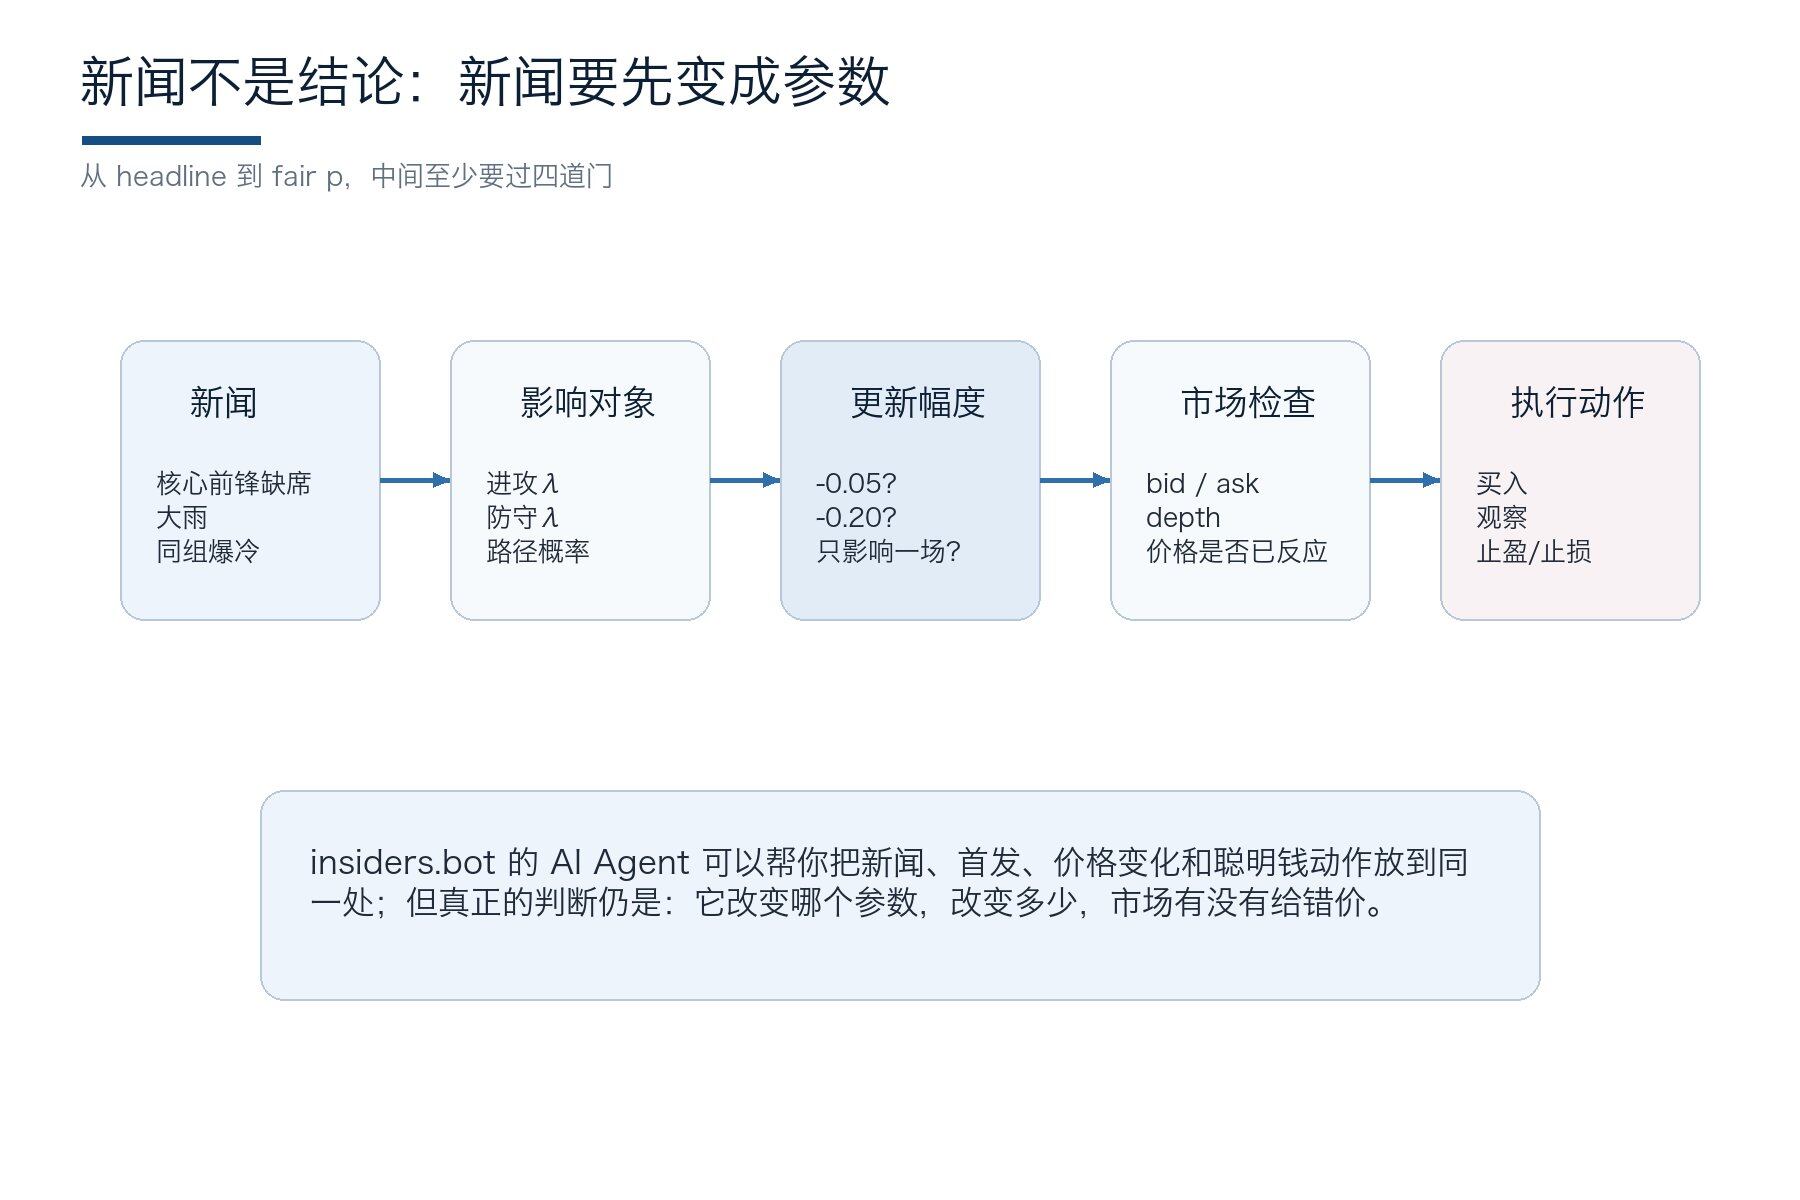 figure 16: news transit parameters: key messages need to be transformed into diarrhea, path probabilities and implementation zones。
In the run-up to the opening, the information density will suddenly rise:Big lists, hottest races, absences, major injuries, intra-team conflicts, coaching sessions, travel arrangements, site adaptation。ordinary readers read the news, traders watch the parameters. the news itself is worthless, and only in ways that change news, road probabilities and market prices。
The injuries can be updated in layers. The first level is an irreplaceable core: a doorman, a single nuclear front, an organizational core, a single outer, a single defensive backside. The second tier is an important but supplanted system. The third level is a well-known but more tactical alternative. Markets often react poorly to the first tier and over-reaction to the third tier. The bigger the name of the star, the easier it is to suck away; the real change in the game structure is sometimes the one that doesn't have much hot search。
the warm-up is more careful. the warm-up score is often more useless than the structure of the warm-up. what you want to see is: is the dominant framework stable? is it going to last? is the sidewalk smooth? is there a systemic loophole in the gps defense? after the replacements, is it a cliff break? these things are worth writing more than 3-0 or 0-1 models。
This step is best for AI angent. A good agent should not just give a summary of the injury to a player, but rather a model proposal: an attack by 4-8 percent, a counter-attack by 2-5 percent, a locator ball by 5 percent, and a nod. Manually, the parameters can be changed, but the machine first captures the suspicious variables。
The pre-game news solved the preparations, the 30 minutes before the opening was the judgment. This phase is most dangerous because prices have started to move and emotions have begun to move. Let's not rush the trade score, let's judge which type this game is turning into: the strong team is slow, the structure is grammed, the rhythm slows, or the market is just a mechanical correction of the passage of time。
5.7 30 minutes after the start of the race, don't rush the trade score
Live trafficking most tempting, and dangerous. Ten minutes after the opening of the race, one shot, one yellow card and one doorpost started to jump. Many people think they're trading in information, actually, adrenaline. The right approach is to judge the type of competition before deciding whether to change the model。
- The first is model recognition. Before the race, you thought Team A would continue to suppress, and when it started, Team A did push the ball into a high-threat zone, XT, no-go, no-go, no-go. At this point in time, it may be a silo window if the market lowers the price simply because it failed。
- THE SECOND IS THE NEGATIVE MODEL. BEFORE THE RACE, YOU THOUGHT TEAM A WAS IN CONTROL, BUT THE MIDDLE OF THE SCENE WAS PIERCED, THE BACK LINE WAS RETREATING, AND ALL THE ATTACKS STOPPED IN THE MIDDLE OF THE LOW-VALUE TRANSMISSION ON THE SIDE ROAD. EVEN IF THE SCORE HASN'T CHANGED, THE MODEL SHOULD BE DOWNGRADED. DON'T WAIT TO THROW THE BALL TO ADMIT IT。
- The third category is noise. Two feet away in five minutes, a sidewalk yellow card, a long pass of the door, and the price moved three points. The best transactions at such times are often untraded. In predicting markets, restraint is not without perspective, but rather knows what changes are not worth paying fees and slip points。
The fourth category is a state mutation. The red card, the core injury, the sudden weather changes, the VAR pointer, the door will be injured and the game structure will be changed directly. And here's the quick rerun, not the original model。i don't know, insidersAI Agent can put a price move, a walker and a news source in the same place, so you can judge why the price moves, and then decide whether to pursue。
Live deals are the easiest because prices are moving, the ratio is moving, and the media is moving. The more time comes, the slower the move: first the type of game, then the variable, then the price。
If the team doesn't make it in 20 minutes, the price drops may be an opportunity; if the team doesn't move into the danger zone, the price drops are a correction. There is only one difference between the two and the result is completely different。
once judged individually, the dissemination of information between markets can also be seen. the same variable may be reflected in the offline market before slowly reaching the champion market; it may also be eaten by the live market before affecting the ranking price of the group. the difference does not have to be a godly package, it is more a sign of a flow of information, and reminds you to find out which contract has not been re-evaluated。
5.8 Cross-market differentials, not arbitrage myths, but shadows of information flows
During the World Cup, the same event may have been priced in multiple forecast markets, data terminals and liquidity sites. Polymarket, Kalshi, front end of different transactions and social flow of information, with different regulations, different users, different mobility and different response speeds. Price differentials do not necessarily amount to risk-free opportunities, but often point to information flowing。
If a trading site has pushed the hidden probability of a team advancing from 58% to 64% and another forecast market is still at 59%, you ask:Is the latter slow to react, or is the former a price jump caused by a small number of orders
If Polymarket suddenly gets a big bill on one of the contracts and the other markets don't move, you ask: is it smart money with information, or is a wallet adjusting the overall risk
Cross-market strategies fall into three categories。
- The first is the real price differential: the same settlement condition, the same event, sufficient liquidity, and price differentials that cover costs。
- The second category is the soft price differential: events are similar but settlements vary and need to be converted。
- The third category is signal price differentials: direct arbitrage is not possible, but a hint is being made that a market is being revalued。
ordinary users are most likely to make mistakes in category ii. for example, the winner's finals, the winning half zone, the first team, is not the same payoff. they are relevant but do not directly diminish arbitrage. the real professional approach is to use path simulations to place them on the same probabilities tree and then to judge what is wrong。
Virtual reference
The case of cross-market price differentials: the first price for a team was higher, but the champion price remained the same; or the price of the exit line was already favourable, while the champion price was too high. Neither is risk-free arbitrage, but information is disseminated at different speeds between markets. Dealers ask, "What market expresses variables more directly? Which market is more liquid? Which market has been eaten by smart money
Herewww.insiders.botThe order book analysis and the spectrometer are more suitable for radar and not for steering。When you see the big wallet move, look at the probability of the chain it buys: line, half zone, champion, single. It's worth a single speed, but it's not a shadow when you can explain why it was bought。
After seeing opportunities across the market, there is also a return to portfolio risk. The most hidden mistake in predicting the market was to buy four points of view for itself, but only four times the same team, the same half-zone, the same result. In the next section, the associated risks will be spread out so as to avoid a seemingly fragmented and highly concentrated position。
5.9 Combining position. Don't buy the same risk three times
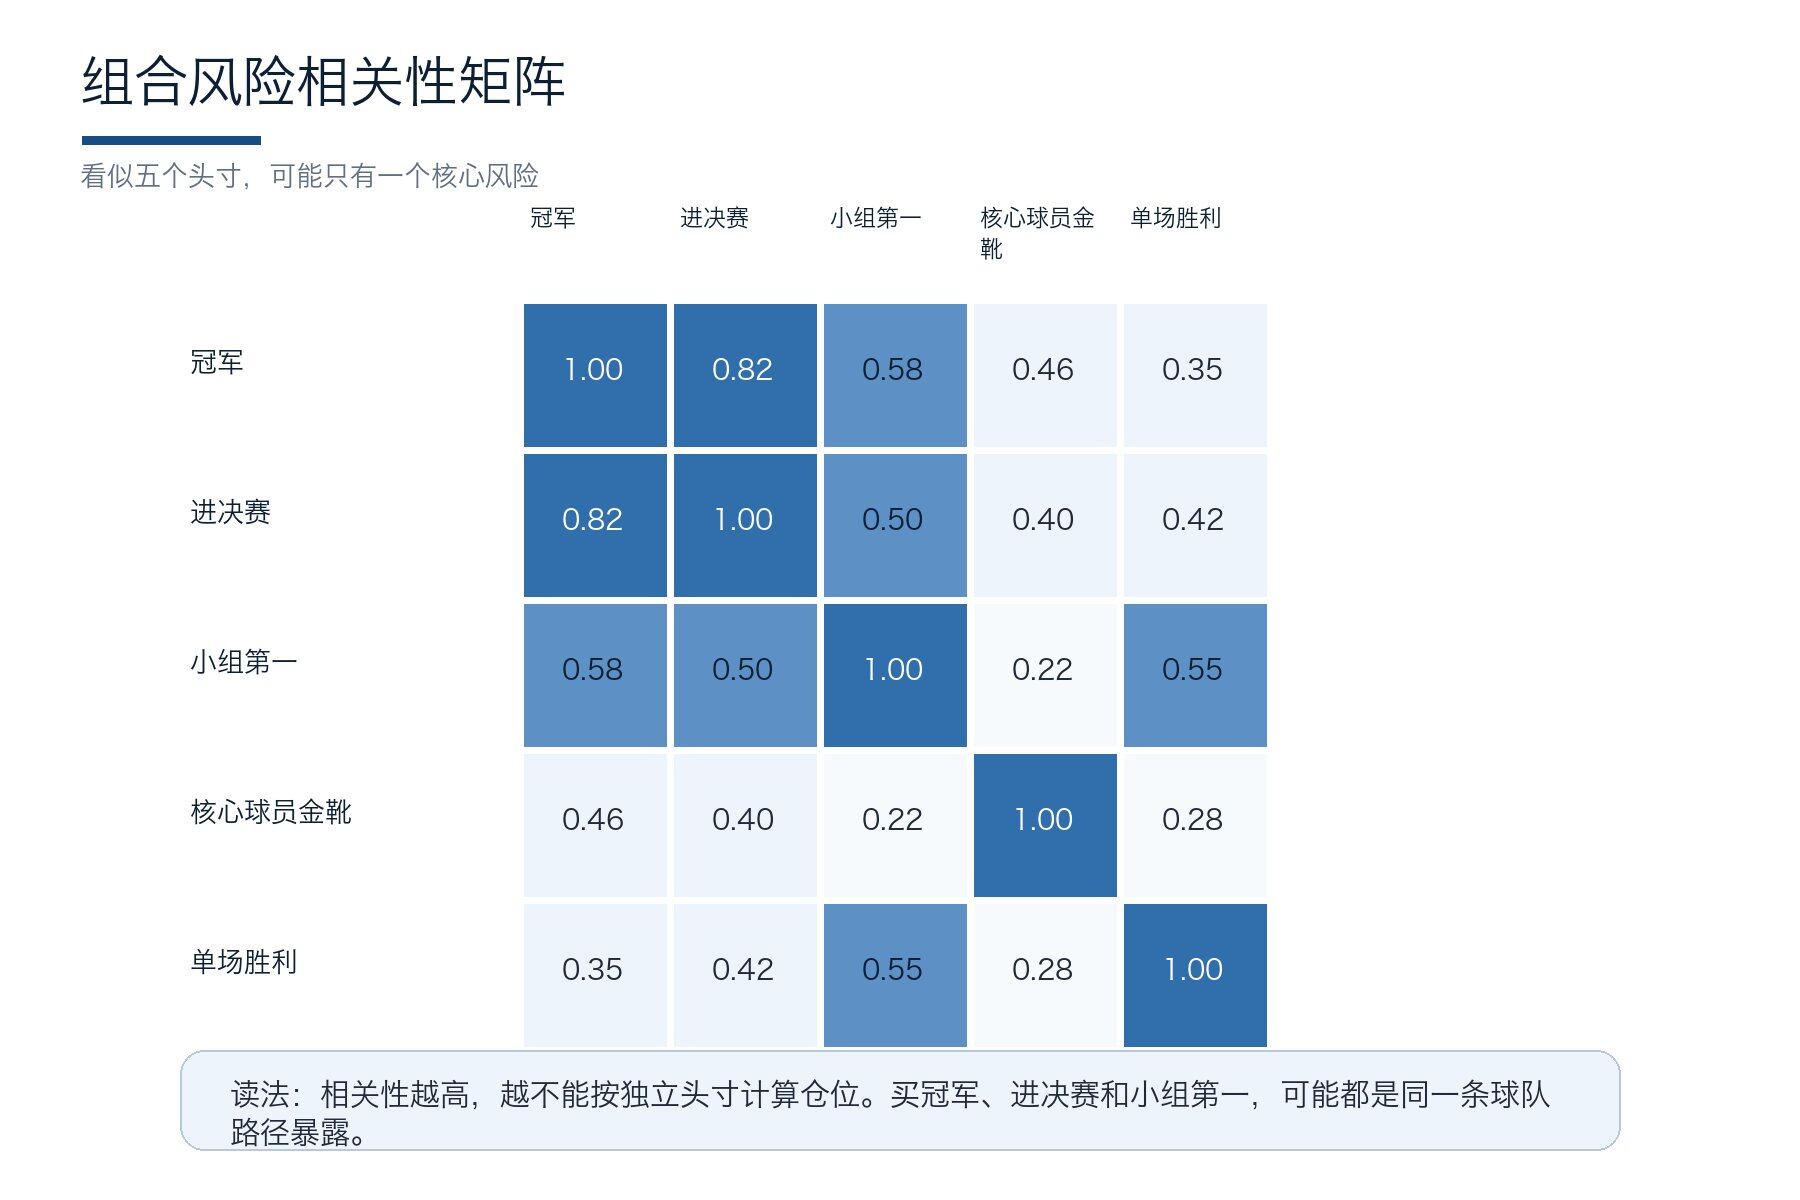 Figure 18: Portfolio risk correlation matrix: Multiple contracts may be a different shadow of risk along the same path。
The World Cup market will give you a lot of seemingly different contracts: a team to win, finals, four best, first team, gold boots for players, one team to win. It is easy for newcomers to consider them as scattered slots, and in fact they are often highly relevant. You think you bought five ideas, actually five shadows of the same story。
the first type of portfolio management is relevant. buying the french champions, the french finals, the mbapekin boots, the french team first, these slots make money when france is in good shape, and they get hurt when france is injured or out of the game. they should not be calculated as 1% bankroll, but combined into "french path exposure."。
number two, is to write hedge in front of the warehouse. if you buy a team of champions because it's cheap, then once the path is re-evaluated by the market but the real strength of the team remains the same, you can sell some of the champions and move to four or one-field promotions. if you're buying a single-stage reverse, you're gonna have to cash it out before the branch, not drag the short line to faith。
The third is to retain cash. The World Cup has the highest information density opportunities, often in the second and third rounds of the panel race. Filling the space before the race is tantamount to selling the best options ahead. Cash is not idle and cash is the option to wait for market errors。
When the risk is clear, it is not the grounds for entry, but the conditions for failure. Because entry is exciting, failure conditions make people alive. If there is no clear line of failure, the more the price falls, the more the story will be added, and eventually it will slowly turn from trade to faith。
5.10 Conditions of failure are more important than reasons for admission
Each transaction should have a condition of invalidity. Transactions without conditions of invalidity end up in prayer. The grounds for entry are elegant and the exit rules must be cold。
The condition for failure is that the path has not improved as expected or that the market has fully priced the improvement. Processal inversion transactions are subject to the condition that the next launch and tactics do not support process improvement or that the xG advantage comes from unsustainable single points. The underestimation of the invalidity of the transaction is due to over-expected replacement performance, successful tactical adjustments, and faster-than-execution market repairs。
the conditions of non-performance at the price level should also be clear. your fair p = 18%, buy price 14%, stop profit 20%, not just 10%, but thesis invalidation: the core variable has changed, and the fair p has been repaired to 13%. if the fair p is still 18%, the price drops to 12%, perhaps a silo; if the fair p has become 11%, the price is 13% expensive。
THIS IS THE REAL VALUE OF THE TP/SL TOOL. THE STOP AND STOP ARE NOT MECHANICAL POINTS, BUT THE OUTER CASINGS OF OPINION DISCIPLINE。
i don't know, insidersBy allowing users to trigger entry, TP, SL, Wallet signal and news, I can turn "I think" into "I do it systemically."。
There are enough models and cases. The next step is not to continue to be complicated, but to compress them into a study form that they can use on a daily basis. Only when variables, prices, actions and discs are written in the same format will the methodology be transformed from articles to systems。
5.11 A personal study form from scratch
If you start today, you don't have to write complex codes. First, a table showing each team: Elo, the probability of an implicit champion in the market, the recent 12 XG negatives, the health of the core players, the stability of the coaches, the team path, a possible half-zone, the market price, your fair price, edge, notes。
The second table records each race: before the race, after the match, after the game xG, before and after the red card splits, key injuries, market price changes. The third table records each transaction: the reason for the purchase, the price of the purchase, the target price, the condition of the expiry, the reason for the sale, the proceeds, the reset。
These three tables are simple, but avoid the most common illusions: remember only the winnings, forget the losings, remember only the right direction, forget the bad prices, remember only the market that later proved itself right and forget that the middle was not able to pull back。
The goal of the research system is not to make you look professional, but to stop lying to yourself. The biggest opponent in the market is not the market, but the one who always finds a pretty good excuse for losses。
Virtual reference
readers can start with a very small table: eight teams, each with five fields: the base is weak, the core variables, what is most feared, what is most likely to be misunderstood by the market, which market i would trade. before each game, write the fair p, then open the market price. this sequence is crucial, with prices before probabilities are written, and people will not come closer to the market。
if you don't want to maintain a complex watch yourself, you can give the filter to the tools: just a market with sufficient liquidity, just a market with a spread below a certain threshold, just a market with smart money 24 hours active, but not far away。
i don't know, insidersHigh-defined filters and natural language interactions are suitable for automating these boring but necessary screenings。
once the basic system is in place, the next step model is added. they are not supposed to look so quant, but rather to deal with the sides of the underlying model that are missing: abnormal points, high-level tails, drifting of the team, broken players. the value of advanced models is not to make articles more difficult, but to make the real world less open。
VI. PROGRESS MOBILIZATION: ANAZE BETWEEN ACHIEVEMENTS, Dynamic StrengthS AND FACTUALS
When the underlying model runs through, the real difference often comes from detail。
Anomalous scores, a shift in team status, player functionality and positioning balls are magnified in the short range。
This part, we're going to use some step-by-step models to make your trading strategy a step up. This includes..
- Negative binary and zero inflation for extreme (e.g., time race) conditions distribution
- Dynamic spatial models for those factors that can influence the team as a whole
- A trophies model for modelling the players themselves
- A positioning ball model to see the impact of a player's location distribution
- fair-p calculation scenario simulation model in advance
6.1 Negative 2 and zero inflation, with one exception The door
Poisson is elegant, but elegant is not the same as full power. It has an implicit condition: the average and the difference are tied very tightly. In football, some games are more volatile than Poisson expected. For example, the third round, where both teams have to win, the opening after the early red card, the garbage time after the weak team collapses, will thicken the tail of the goal number。
The negative two models are often used to deal with over-dispersion, i.e. where actual fluctuations are greater than Poisson. It acknowledges that some of the games are more likely to reach extreme points on the same average. For the traders of the World Cup, this is not academic detail, but the end pricing of the ball, the ball and the exact score。
The zero-inflation model is revised in another direction: some games have an exceptionally high probability of zero. The early stages of the phase-out, the end-rounds of careful teams on both sides, and the win-win-win situation may give 0-0 or 1-0 weights higher than normal models. If the market is still priced at the usual pace, Underwood and Draw may have a cleaner edge。
In practice, there is no need to complicate it from the outset. You can start with Poisson as a baseline, and then you can start with the match lines: you have to win a big team, you have to raise the top to the bottom; you have to keep both sides on the same side, and you have to increase the weight of 0-0, 1-1; and you re-evaluate the pace of the game when the red card or early ball appears. The model is not for beauty, but to keep the reality out of the stitches。
Virtual reference
Negatives and zero expansions sound like steps forward, but drops directly: when you find that some kind of competition has a high score or 0-0 significantly more than Poisson expected, you don't have to use normal models. For example, strong and weak and strong teams must have a clean shot, with a loose end of the division; the balance is good for both sides, with 0-0, 1-1 power being raised。
On the disk, it is written as a scenario adjustment rather than a complex term: a 3-0, 4-0, 4-1 netting; a win-win win-win, 0-0, 1-1; a red card comes early and increases the margin difference. Readers do not have to estimate the full parameters at first, just know when normal Poisson is too narrow。
The tail liner addresses an abnormal score, but the team capacity itself moves. The World Cup is not a static photo, but a video that changes rapidly over a short period of time: injuries and illness, a change of generation, and tactical frictions change real power. So we need a dynamic state model that looks at the team's ability as a level of water that rises over time。
6.2 Dynamic space. Team strength is not stone, but water level
Many models use team strength as a fixed value. In reality, power is more like a water level: it rises, falls, it moves slowly because of injury and illness, change of generation, coaches, tactical maturity. Elo is already a dynamic model, but it is mainly updated from the results; the state spatial model allows for a more detailed description of the ability to drift over time。
Country teams in particular need a dynamic perspective. Four years ago, the champion's base may have grown old, the main combination of pre-selections may have been broken up before the big game, and young players may suddenly grow up in the club season. The slow change would be missed if the model only averaged historical achievements; if only the last two scenes were seen, they would be deceived by noise。
The description of the status space can be understood as two layers: the hidden layer is real, the observation layer is the result of the competition, xG, the hidden probability of the market, and the formation. Real capacity is invisible and can only be inferred from observations. After each race, the model is not simply a point-down, but rather a question: How much has this data changed our belief in the ability to hide
Disassembly, dynamic models are suitable for the replacements and the Blacks. Markets are often slow to respond to old reputations and are often over-responsive to the outbreak of younger teams. The value of dynamic models is to separate “this team is getting better” from “this team is getting lucky”. The former can be bought, the latter sold to emotions。
The state space looks at the team as a changing whole; the player-level model further reminds us that the national team is not playing with the badge. Markets are often over-responsive to big names but under-reacted to unknown key positions. The next section will be to take the team back to the player function and see how the absence and the initial change should change the probability。
6.3 Baseball model. National team isn't playing. Ball
The name of the team is so lazy. France, Brazil, England have their own rings, but the game is 11 people, and the replacement seats will change in 60 minutes. What's the point of a player-level model is to take back the badge。
The players layer variable includes at least four categories。
- First, capabilities: club performance, location contributions, xG/xA/xT/defensive actions。
- Second, health: history of injuries, recent appearances, whether they have just healed。
- Third, the role: whether or not to play familiar positions in the national team system。
- Fourth, alternative: without him, the replacement can keep 80% functional。
a world-class edge is absent, and if there are two identical replacements on the team, the downward revision of the model may be limited. an unnamed backside absence, if he's the only one who can protect the middle guard and connect to the ball, the opponent's counterattack may rise significantly. mass markets are more vulnerable to overreaction and under-reaction to the latter。
disassembly action, a player-level model is best suited to the injury market and the short window after the launch. when the initials come out, don't just look at the "not on a star." it depends on the whole chain: point of impact, trigger point of oppression, the main penalty for positioning the ball, pointer, double impact. real formation edge, often hidden in tactical functions, not in posters。
Virtual reference
the player layer model is best used 30 minutes after the launch. the absence of a ball star is only a first step, and more importantly, the question is whether it is functional or not. if a sideline is absent, the influence may be limited if the replacement provides the same depth; if a backside is absent, if he is the only one who can protect the middle guard, the counterattack may increase significantly。
This will allow AI Agent to summarize the initials, changes in location, replacement seats, past country teams, and then map the changes to your swirling or winning adjustments. If the market has already hit its head overboard because of big cards, there may be reverse buying points; if the market ignores the key to anonymity, it is the real model opportunity。
In addition to the player function, there is an often underestimated leverage in the short run: a locator ball. It is not popular, but it often rewrites the phase-out contest, because one corner ball, one random ball, one no-go-zone battle is enough to replace the low-point game with a world line. And then we'll price it separately。
6.4 Positioning Ball Model, the weapons most likely to be underestimated in short courses
the world cup is short and the weight of the positioning ball is magnified. a team may not be able to create much of an opportunity for an open play, but it can make a decisive shot with an angle ball, a field ball, a two-point ball and a pointer ball. in a cup game, the locator ball is not a side dish, it's often the main course。
the positioning ball model depends on both ends: offensive and defensive. antagonal ball quality at the end of the attack, main foot method, front-point running position, high-point numbers, two-point oppression; a defensive end looking at the human/regional system, door-to-door attacks, protection of restricted areas, deviance. if a strong team has a weak defensive locator and faces a high-level team, upset probability will be higher than normal models。
Pointball is also in the broad range of positioning balls. Team races, VAR and no-go zone confrontations affect the probability of a point ball; in the phase-out game, a point-off is another level. The doors, the PSxG, the tipping point, the depth of the main penaltyr, all deserve a small stand-alone model。
And when it's actually done, the locator edge fits into three types of market: the weak team is cold, the two teams are going to hit, the exact score. If the weak team open play but have a good positioning ball, the championship market is not necessarily valuable, single-stage upset and BTTS may be more valuable. The market looks at the stars, the positioning ball looks at the details. The details, the leverage of the short course。
The more detailed the model is, the less it can be calculated in the future. Because when the score, the red card, and the results of the group appear simultaneously, the price will not wait for you to open the table slowly. The real speed comes from putting critical scenarios ahead of the race: what's the score to recalculate, what's the price to stop, what's the change to just noise。
6.5 Scenario evolution, without waiting for future events to begin calculating
THE REAL SPEED OF THE WORLD CUP DEAL COMES FROM THE PRE-GAME SCENARIO. YOU CAN'T WAIT UNTIL TEAM A 2-0 LEADS, TEAM B RED CARDS, AND THE SAME GROUP GETS ANOTHER COLD, AND THEN YOU START TO FIGURE IT OUT. THE PRICE WAS ALREADY RUNNING。
The right approach is to set out the key scenarios before the competition:A wins 1 ball, A wins 2 ball, draw, A is negative, the same group gets cold, the core is down, the red card happens. Ranking, netting, chances of promotion, champions, tradable markets. Once the race goes into a situation, you're not playing the game, you're executing the plan。
To give an abstract example:
- one of the team's pre-winners, fair p = 6%, market 5%。
- if the first round of 1-0 small wins, the fair p only rises to 6.8 per cent and does not need to be pursued
- if 3-0 wins and the same group of strong enemies is even, the path p could rise to 8.5%, and the market would be an opportunity if only 6.2%。
- The score is just like the news, and the path is completely different。
the scenario also helps to stop. if you buy thesesis, the market underestimates the team's first probability, and when the team locks in ahead, the price should be paid。don't take the path that's been fulfilled, edge, hard to the champion faith. the virtue of the deal is to walk away。
This is the end of the step. Finally, back to implementation: whether a system works depends not on how beautiful its concept is, but on whether it becomes a template, a flash drive and a routine process。
the following sections will tear down the champions' markets, team lines, one-time live, and reset into practical strategies that you can do。
Implementation system: templates, duplicates and minimum feasible workflows
And finally, we're going to turn research into routine。
Forecasting the market does not end with a model, and the real ability comes from recording, implementing, replaying and then turning the error into the next parameter。
In this chapter, I would like to conclude by talking about the trade in the World Cup, what kind of work flow is needed。
7.1 Trading Template I, Pre-winner Champion Market
The template for the pre-winners market can be very mechanical/simplified。
- First row is the team
- The second column is market prices
- the third column is yours
- The fourth column is path adjustment, and the fifth column is liquidity
- The sixth column is a trade move。
- Practically only four are allowed: buying, observing, selling/evading, waiting for better prices。
if the fair p is one or two points below the market price, it is not usually worth trading. the world cup is a long-term contract with long-term funding and a period of high public information risk, during which small edge will be eaten by time and uncertainty unless mobility is excellent and paths improved. the pre-winners market is better suited to look for structural deviations above 3-5 points。
don't buy it every day because of price fluctuations. the pre-winner silo cycle should revolve around information nodes: large lists, core injuries, first round of teams, second-round post-roads, abstract paths to the phase-out race. in the absence of new information, price fluctuations are only market breathing; new information is available to recalculate the fair p。
the cleanest pre-winner deals are market underestimation of paths, not market underestimation of fame. the reputation will soon be discussed and the path will need to be calculated. it's where we can calculate that it's easy to find a edge that people don't care to take。
The champions ' market is long-cycled, path-heavy and suitable for expressing long-term structures; the team exits a shorter, faster market and is better suited to train traders ' sense of probability. Readers who are at first free to trade for a full-time champion can learn the path, netter and market before pricing。
7.2 Trading Template II, Team Race Out of Line Market
The team ' s offline market is more suitable for newcomers than the champion market, because of short paths, fast updates and closer settlements. It's also easier to verify with Monte Carlo: it's just a simulation of the three-wheeler and the third ranking, without having to go all the way to the final。
The key variable for the Panel's out-line trade is the state of points. After the first round, the probability of going out increases significantly, but the meaning of different scores varies. The 1-0 team and the 3-0 team are called winning, but the path is not the same. The net wins, the remaining rivals and the third threshold must be seen together。
Around the second round, the exit market is the most vulnerable to misprices。The market extrapolates the first round of contrasting lines, with models depending on the quality of the process and the remaining path. If a team loses the ball but has the advantage of xG, and the next two rounds are weaker, the exit price may be overpaid. On the contrary, a team with a first-round boom and a hard-on may be expensive when the market is high。
On implementation, the offline market is suitable for batching。
- Before the raceOnly part of itAfter the first round of validation
- Second-round paths are delivered and reduced。
- Do not drag the team out to the last ten minutes of the third round, when you are no longer dealing with research, but with heartbeats。
Virtual reference
The Panel raced out of line market case: a team of 0-1 loses in the first round, but xG 2.1, the counterparties will play super-frequently, and the latter two are clearly weaker. The market took it out of line from 58% to 37%. If the model is down to 49%, it is not a consolation prize, but an opportunity to study. The second-round rival, net-winner, third-threshold threshold and market depth are still to be considered before entering。
such transactions are suitable for batches. the first buys only a portion of the model and market margin; the second round is first confirmed and then added; the price begins to run near the model fair p。i don't know, insidersTHE TP/SL AUTO-CLOSURE WILL HELP YOU IMPLEMENT THIS PROGRAM AND AVOID DRAGGING AN OFFLINE TRANSACTION INTO EMOTIONAL RUNNING。
the group market teaches us to look at the path, and single-stage and live test responses. it's not about speed, it's about knowing why. second-level execution is valuable only when the judgement has been completed; if the variable does not understand, speed only magnifies the error。
7.3 Trading Template III, Single Market and Live
The single market is most like a surgical knife. It can be sharp, it can easily cut itself. The pre-game single-course trade is to be broken down from a score matrix into a win-win, a big ball, a goal for both sides, and an accurate score. Don't buy a winner just because you're looking at a team; sometimes your point of view really points to Under, sometimes to Draw, sometimes to the strong but hard to get through。
Live transactions are subject to a ban. I don't see why the prices move, not trade; only emotions, no variables change, no trade; spread is wide enough to eat Edge, no trade; there is no plan before the race, no deal. These four sound conservative, but they filter out large losses。
in order to live, at least five signals should be targeted: whether the thrust of the ball goes into a high-threat area, whether the goal quality is real, whether the oppression continues, whether the alternative changes the structure and whether the market depth supports implementation. the score is the most visible signal, but not the first one. real live edge, often in the presence a few minutes before the goal。
In a scene like this, you can puti don't know, insidersAs an executive panel: read both order blow, Wallet signal, TP/SL and market depth when prices move。
The point is not to copy a wallet, but to determine why the price moved before deciding whether the fluctuations were in line with its own plan。
Virtual reference
Live Case: Strong team starts 20 minutes without winning, Winner prices fall. A lot of people are anxious to get to the bottom, but you have to watch the scene: Did it push the ball into a high-threat zone? Was it forced to shoot? Can you beat them every time? If the goal was simply missed, it might be an opportunity; if the structure was restrained, the fall in prices was reasonable。
the prohibition is written next to the screen: it does not know why the price moves; it eats edge, does not; there is no plan, there is no list. the value of a second-rate transaction is to help you catch the price when you've determined it, not to encourage you to rush in every jump。
After the deal, real learning begins. Without a reset, profits become illusions, losses become emotions. It was not intended to humiliate itself, but rather to disprove whether this time it was a mistake of probability, a poor price, a large silo, or the execution was out of control。
7.4 Rewinding templates
It can't just say "this one earned" or "this one lost."。
A transaction can be broken down into at least four outcomes: correct direction, good price, reasonable position and discipline. All four are right, the good deal is the good deal; the right direction, but the wrong price, may be the bad deal; the wrong direction, but the small space, the loss, the loss, or the good deal。
three probabilities per transaction: p, market q, closing process。
if you go in your direction after a long period of buying, you may have edges; if the end result is sometimes bad, there is no need to overdo it. if you often buy, the price goes in the opposite direction, which means you may be too slow, or the model has no market-known information。
Besides, it's better to record emotionsI don't know。
- Did you chase for missing the last one
- Is the warehouse position amplified by a continuous profit
- Do you lower the evidentiary standard because you like a team
The World Cup is the most emotional event, and if the trader does not record the emotions, it makes them a model. At this point, I'm not afraid to make peacei don't know, insidersThe smart body's talking. Let's calm ourselves down。
The end of the flash drive is to build its own specialty. Maybe you're not good at champions, but you're good at team lines; you're not good at living winner, but you're good at Under; you're good at strong teams, but you're good at underestimating defense teams. The long-term advantage of predicting markets often comes from knowing what kind of issues they are more honest about。
A repeat template starts with the smallest system. Let yourself do it every day, then make it more complicated. A small system covering only 8 detachments, 3 markets, 10 records is often more viable than an unmaintained luxurious model。
7.5 Minimum feasible system for readers
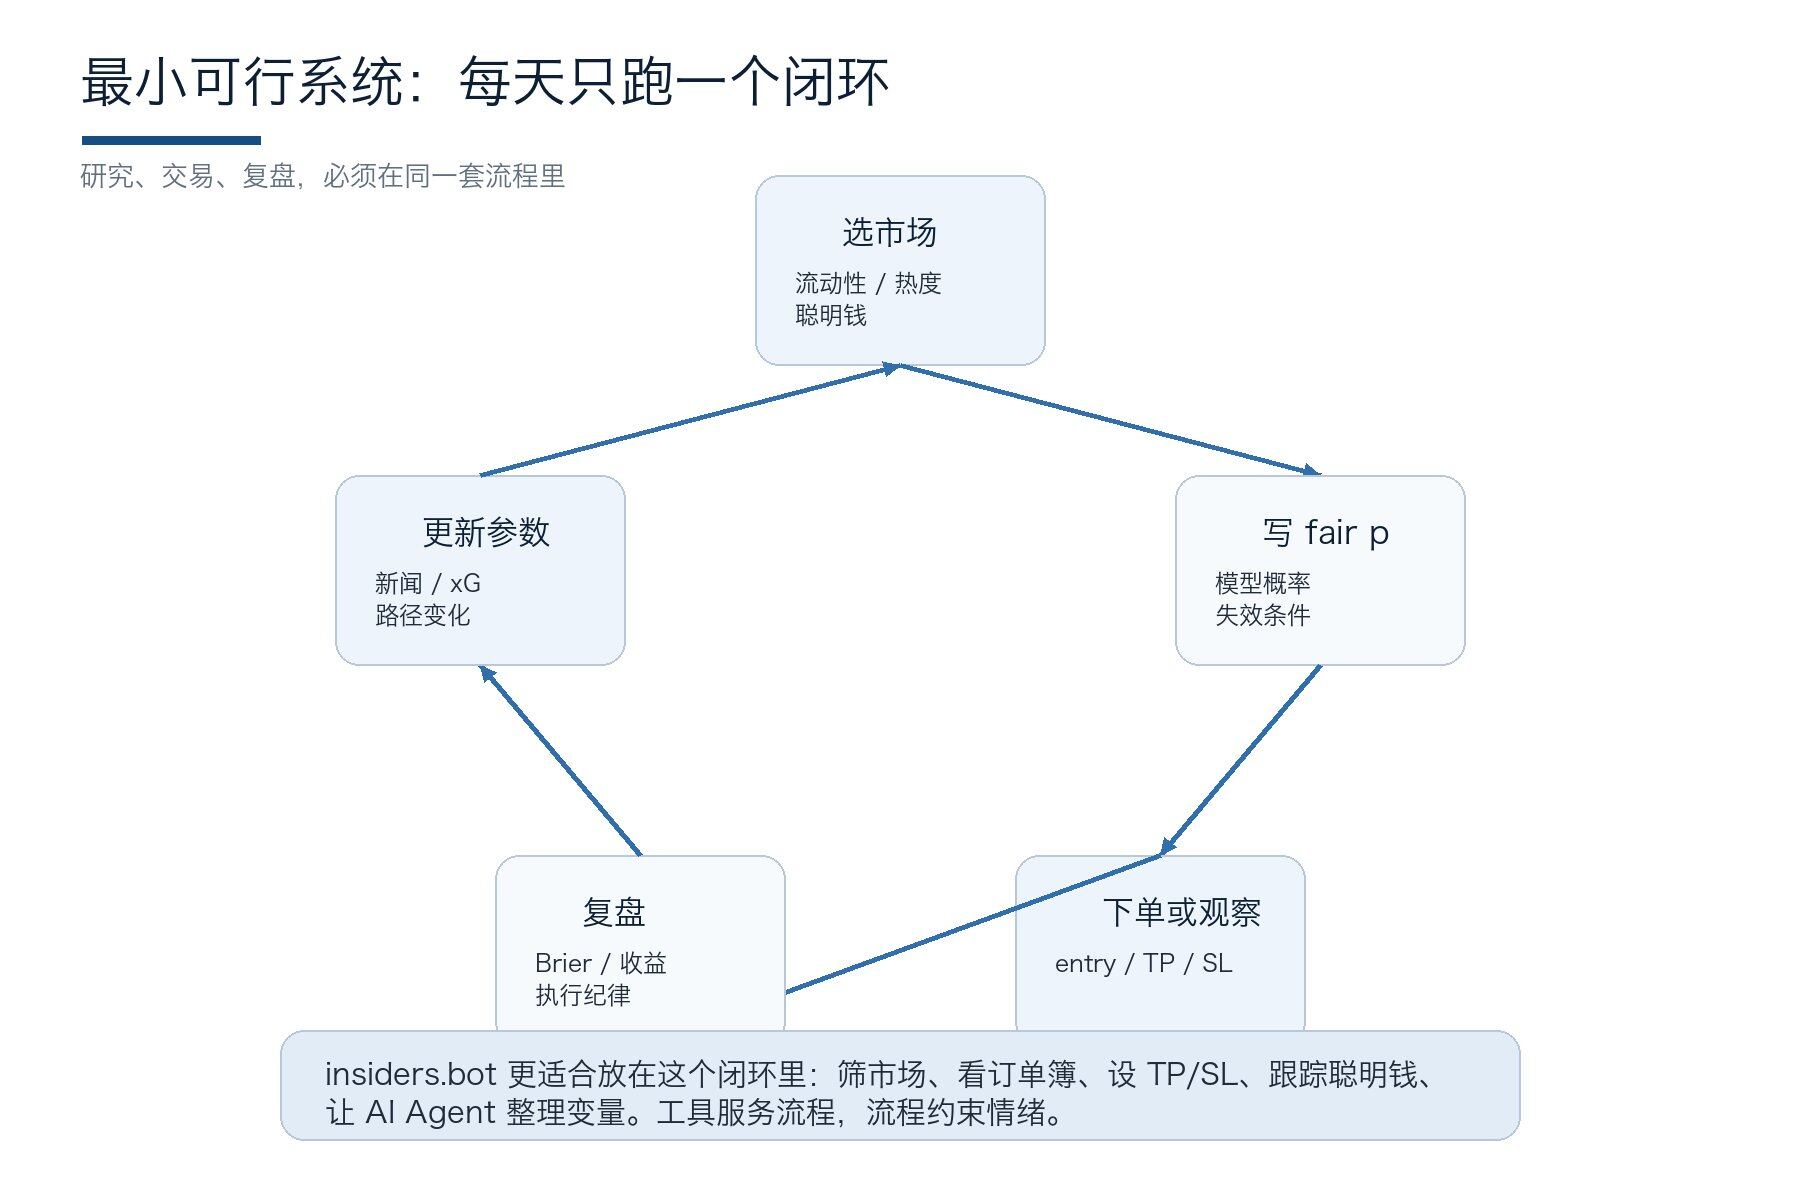 Figure 19: The least feasible system: screening, modelling, execution and discs are closed on a daily basis。
If readers do not want to write codes, they can start with the smallest system。
- Number one, passi don't know, insidersThe top function selects eight focus groups, not all over the world。
- second, write a baseline for each team: strengths, weaknesses, core variables, path risks。
- third, write a fair p before each game, without the market price。
- Fourth, open up the market price and record the margin。
- Fifth, only the trade margin is sufficiently large to justify it. Ensuring adoptioni don't know, insidersADD TPSL TO STRICTLY STOP THE LOSS AND GAIN。
- Sixth, the warehouse space is fixed and at least the first 10 are uncoded。
- Seventh, reset once a day, not because of single-time win-win fixes。
- Eighth, all untraded but observed opportunities are also recorded, as missed opportunities can tell you where the system is deficient。
The smallest system looks dumber than most people's World Cup deal. This is because it trains the sense of probability, then the sense of market and then the training for implementation. Many people are in the opposite order: first to hit, then to lose, then to find a reason, and finally to say that the market is irrational。
The real scientific trade starts with a simple move: write down its own probability before prices appear. As long as you are willing to do so, the market will tell you where you are soberer than the crowd。
The smallest system looks simple, but it solves the most fundamental problem: first to train a sense of probability, then to train a sense of market, and finally to train for implementation. In the opposite order, people are driven away by prices。
Ten days from now, readers will naturally find out what they're good at: people who are good at team lines, people who are good at living under, people who are good at recalculating paths. The advantage is not being shouted, it's slowly being shown in the flash drive。
Virtual reference
The least viable systems do not require luxury. Only three things per day: updating the probability of 8 focus groups, recording 3 of the most unusual markets, replaying transactions or untraded opportunities the day before. Ten days from now, you'll know more about your advantage than you do about the news。
i don't know, insidersIt's more like a workstation: filtering in smart money and hot markets to tell you where to look today, analysing orders to tell you if you can make a deal, protecting discipline with TP/SL, turning a natural language problem into a query with AI Agent. The stronger the tool, the clearer the rule; otherwise, the more quickly the error is made。
if the smallest system can run, the final conclusions of the article will come: at the heart of the predation-marking call is not a magic answer, but an honest treatment of uncertainty. the more you break uncertainty into models, prices, positions and resets, the more you stay awake in the most emotional markets like the world cup。
VIII. CONCLUSION: DEFINITIONS OF CONFLICT
If only one sentence is to be remembered, remember that scientific predictions do not eliminate uncertainty, but rather untangle, bid, execute and reset it。
(If you remember one more thing, it's that the World Cup does a deali don't know, insidersThat's enough
8.1 the real alpha is more honest about uncertainty than the market
The World Cup will reward bravery and punish arrogance. The randomity of football does not disappear from models; the value of models is to allow randomity to have boundaries, price opinions and discipline transactions。
- Poisson told us that goal is a line of probability
- The score matrix tells us that the odds come from the addition of many small cells
- Dixon-Coles tells us that low score has a special structure
- Bivariate Poisson and Skellam tell us that the common state and netting is not negligible
- Elo, Bradley-Terry and Ordered Logit to baseline
- Bayesian holds the steering wheel in a small sample
- xG, XT, VAEP to tear back opportunities and rights
- Machine learning to find non-linearity
- Market consensus reminds us of respect for prices
- Monte Carlo, open the path
- Kelly, let's live。
Finally, there is a sentence: do not ask who wins, ask where the probability distribution and market prices are poor; do not ask whether there is any point of view, whether it covers the costs; do not ask whether it can be profitable and whether the system can stand a hundred times after a reset。
The World Cup is not genre. The World Cup is the largest probability theatre in the world. The market is projected to turn the theatre into a price, while the good traders learn to hear the sound of probability moving before applause. What is truly worth pursuing is not the story of the rich overnight, but the story of the uncertainty that has been told, calculated and implemented over and over again. This can only be achieved over the long term if there is real access to the door to the transaction of events and if there are so-called advantages. The rest is patience, discipline and repetition. May every order be preceded by an honest calculation and record。
