
$80,000 bitcoin: recovery is clear, but faith in cattle markets is lacking
Short-term demand has improved but faith has been slowly re-established, with 87,000 critical resistance。

Photo by Glassnode
Original: AididiaoJP, Foresight News
BITCOIN RETURNED TO THE TOP OF $80,000, WITH IMPROVEMENTS IN INFLOWS, SPOT REQUIREMENTS AND WAREHOUSING POSITIONS. HOWEVER, WEAK CAPITAL INFLOWS AND HEAVY OVERSUPPLY NEAR $86,000 CONTINUE TO LOWER MARKET CONVICTION THAN IN THE PREVIOUS CATTLE-MARKET PHASE。
Summary
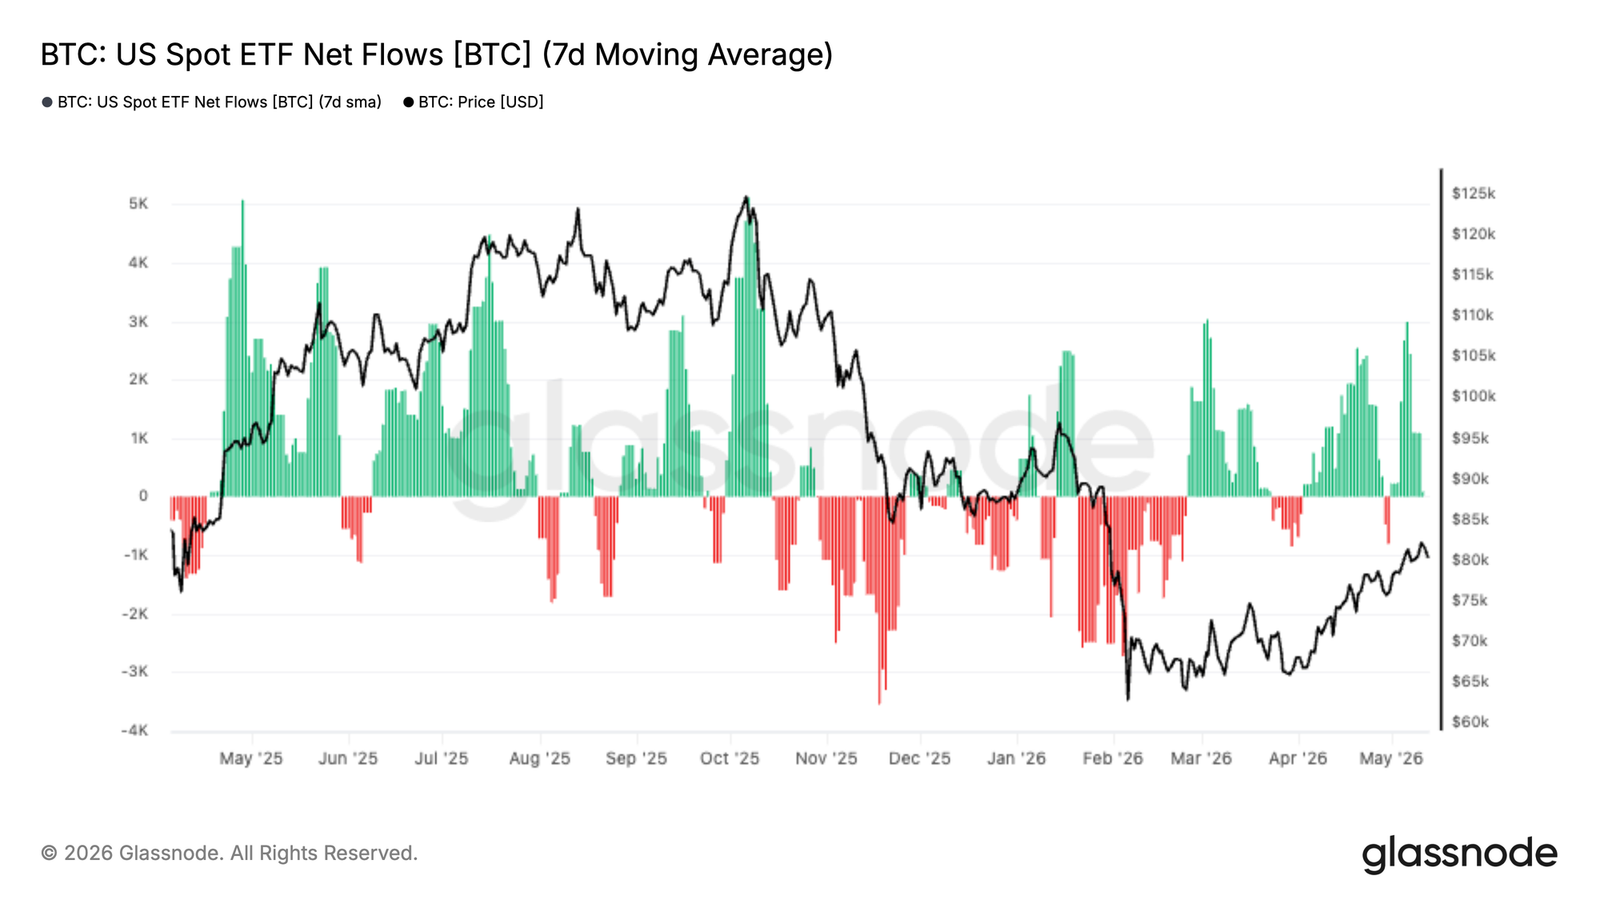
- THE CURRENT BITCOIN ETF INFLOWS IN THE UNITED STATES HAVE AGAIN SHIFTED TO A CLEAR POSITIVE VALUE, AND INSTITUTIONAL DEMAND IS REKINDLING WITH THE RECOVERY OF BITCOIN FROM A MEDIAN OF $60,000 TO A LOW OF $80,000。
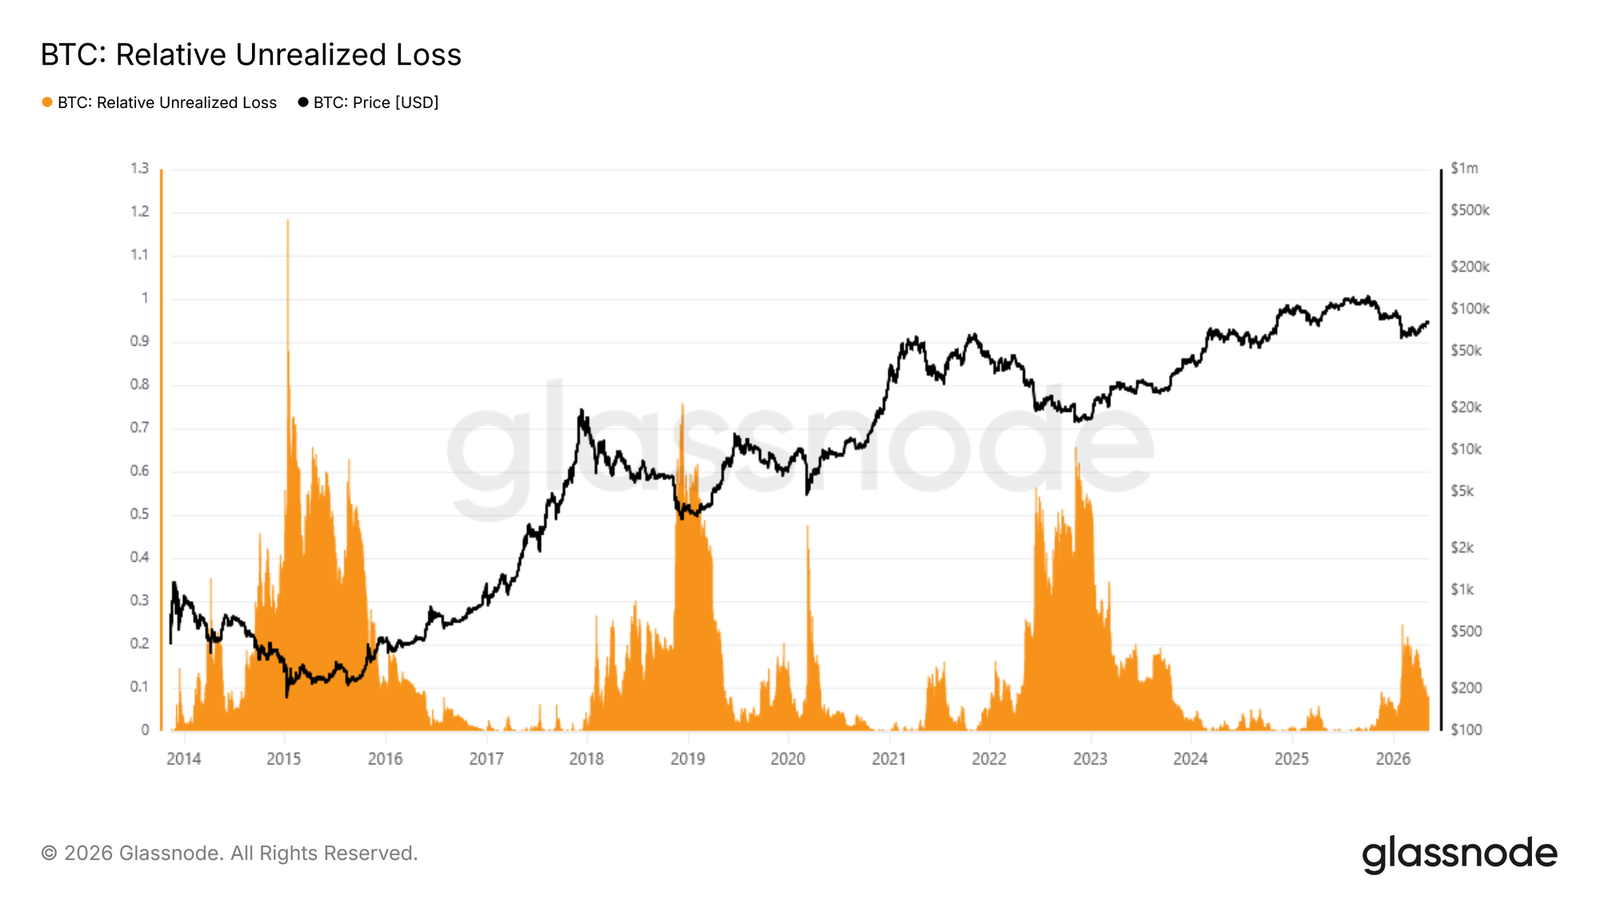
- Bitcoin ' s relative unrealized losses peaked at 25 per cent of the market value during its sale in February and were then reduced to 8 per cent after the recovery of $80,000, supporting the view that the current round would remain in the light bear pattern if $60,000 were to hold。
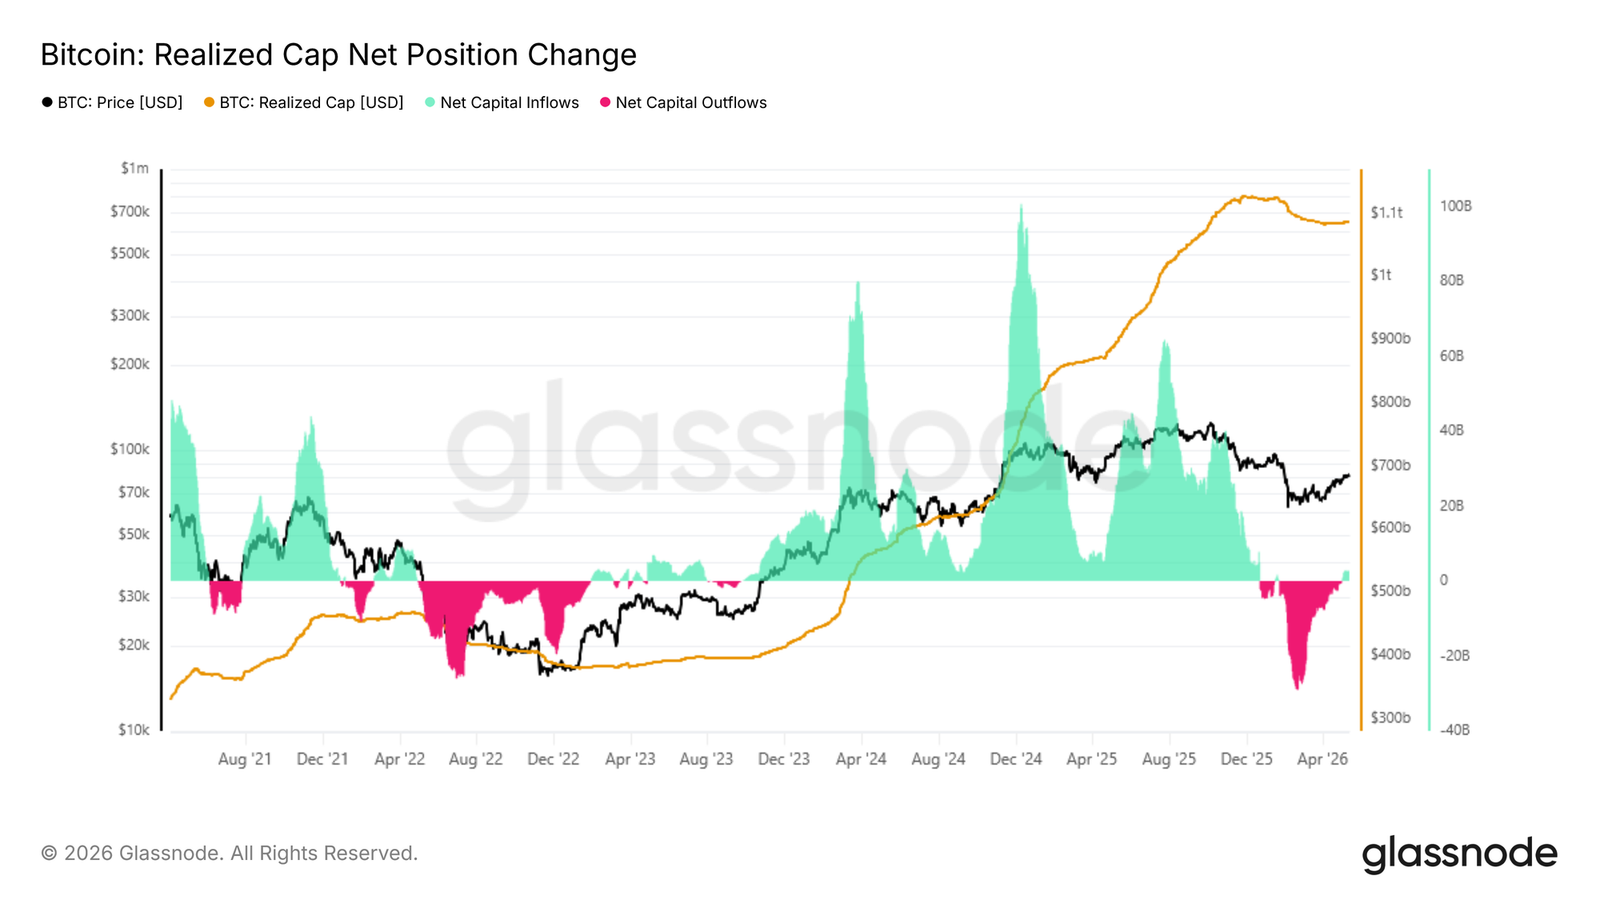
- The realized market value of 30 days of net holding changes has recovered to $2.8 billion per month, indicating that capital inflows are improving, but remain well below the level of over $10 billion per month during the previous cattle market expansion。
- The 30-day cost base is $769 million, which constitutes immediate support in the short term, and $869 million between November and February, which continues to be a critical barrier to recovery in the near future。
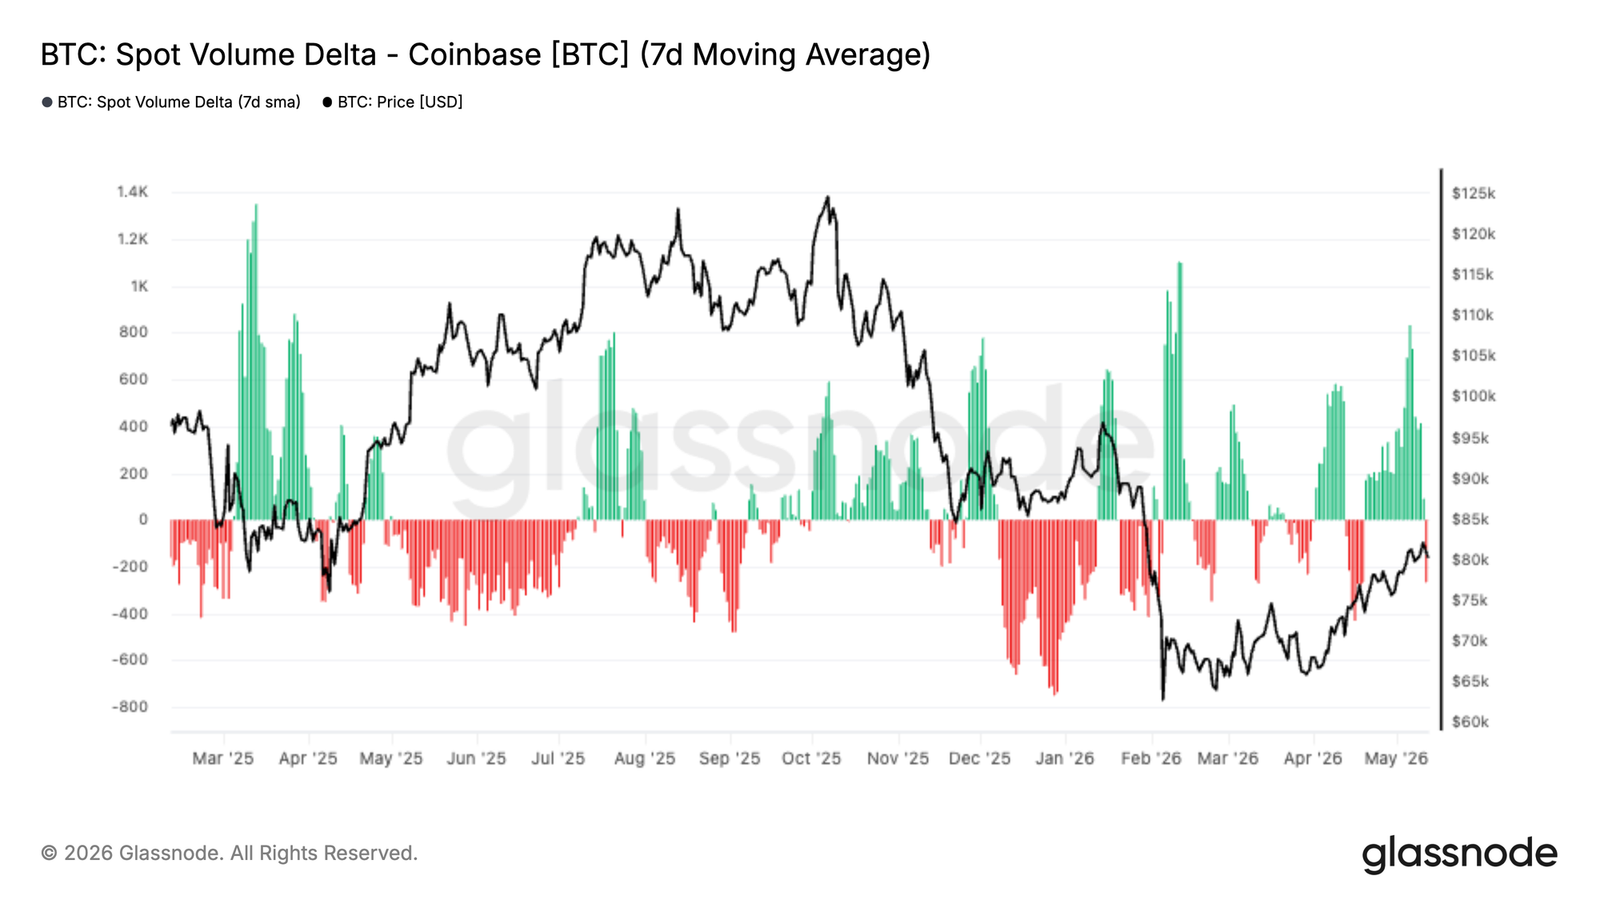
- The dramatic shift of the Coinbase Delta to positive value over the past two weeks is indicative of the increasingly radical activities of buyers and the growing demand in the spot market。
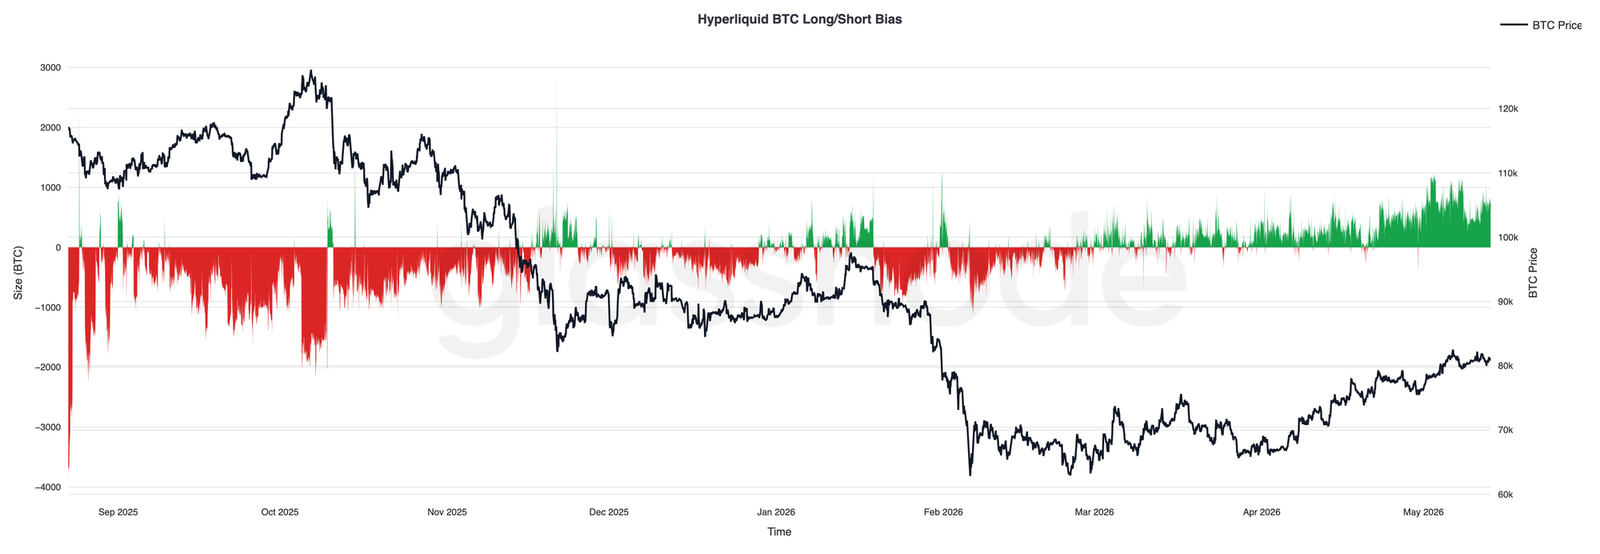
- Hyperliquid traders have steadily re-established multiple exposures as prices rise, reflecting improved speculative sentiment and increased confidence in further progress。
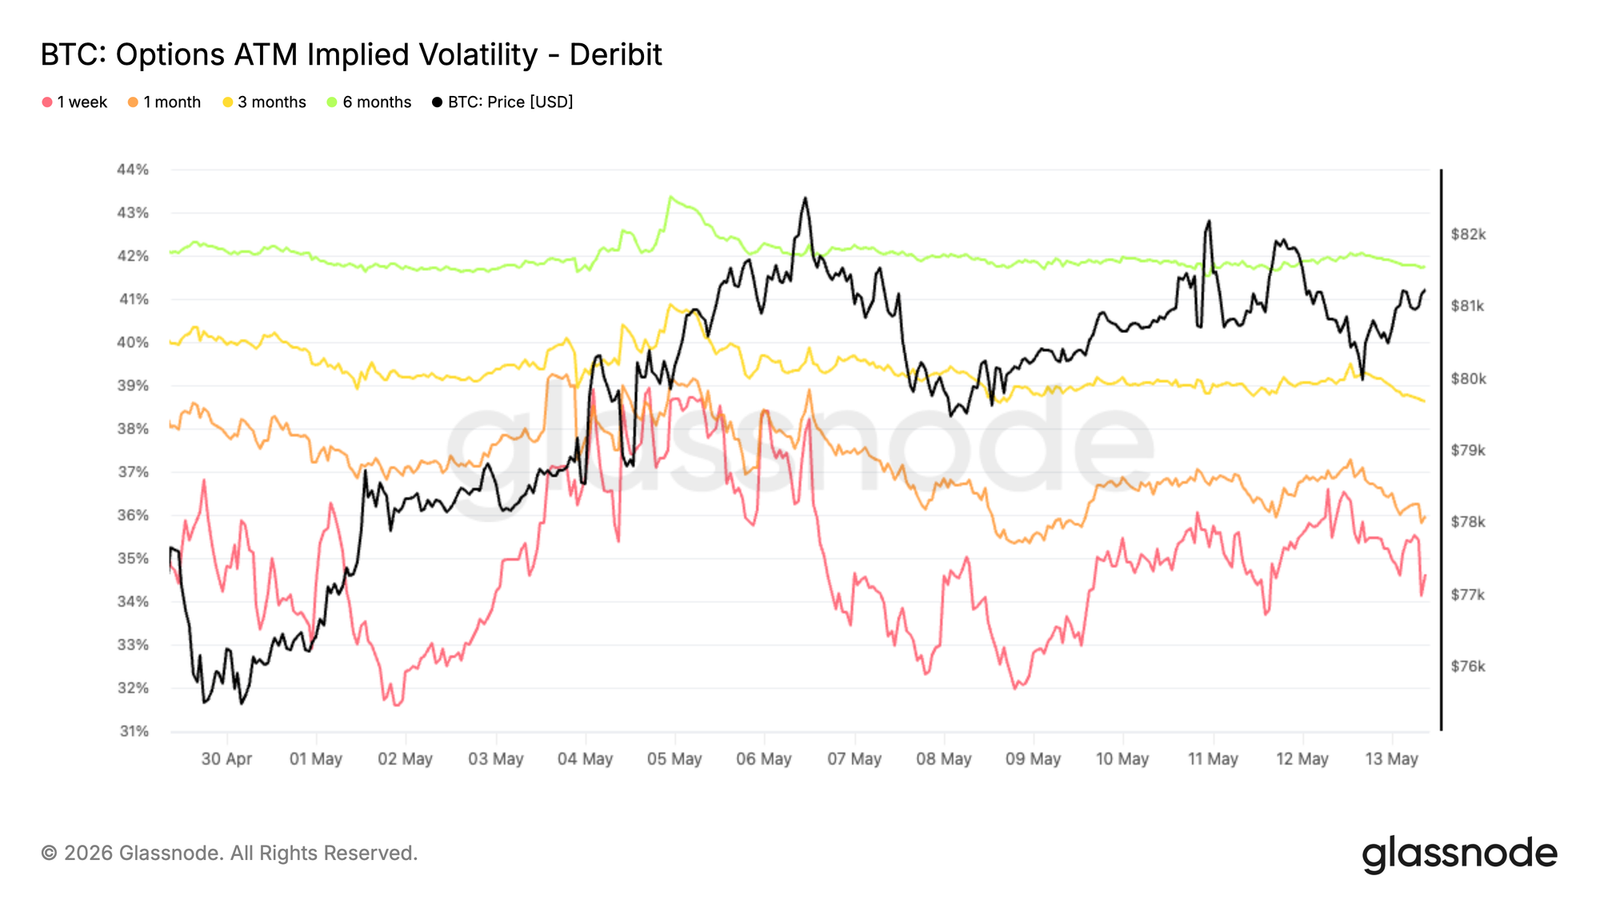
- Implied volatility rates continue to be compressed over the duration of the curve, led by the front end, while the trend towards volatility has been reversed and markets are pricing for a more calm short-term pattern。
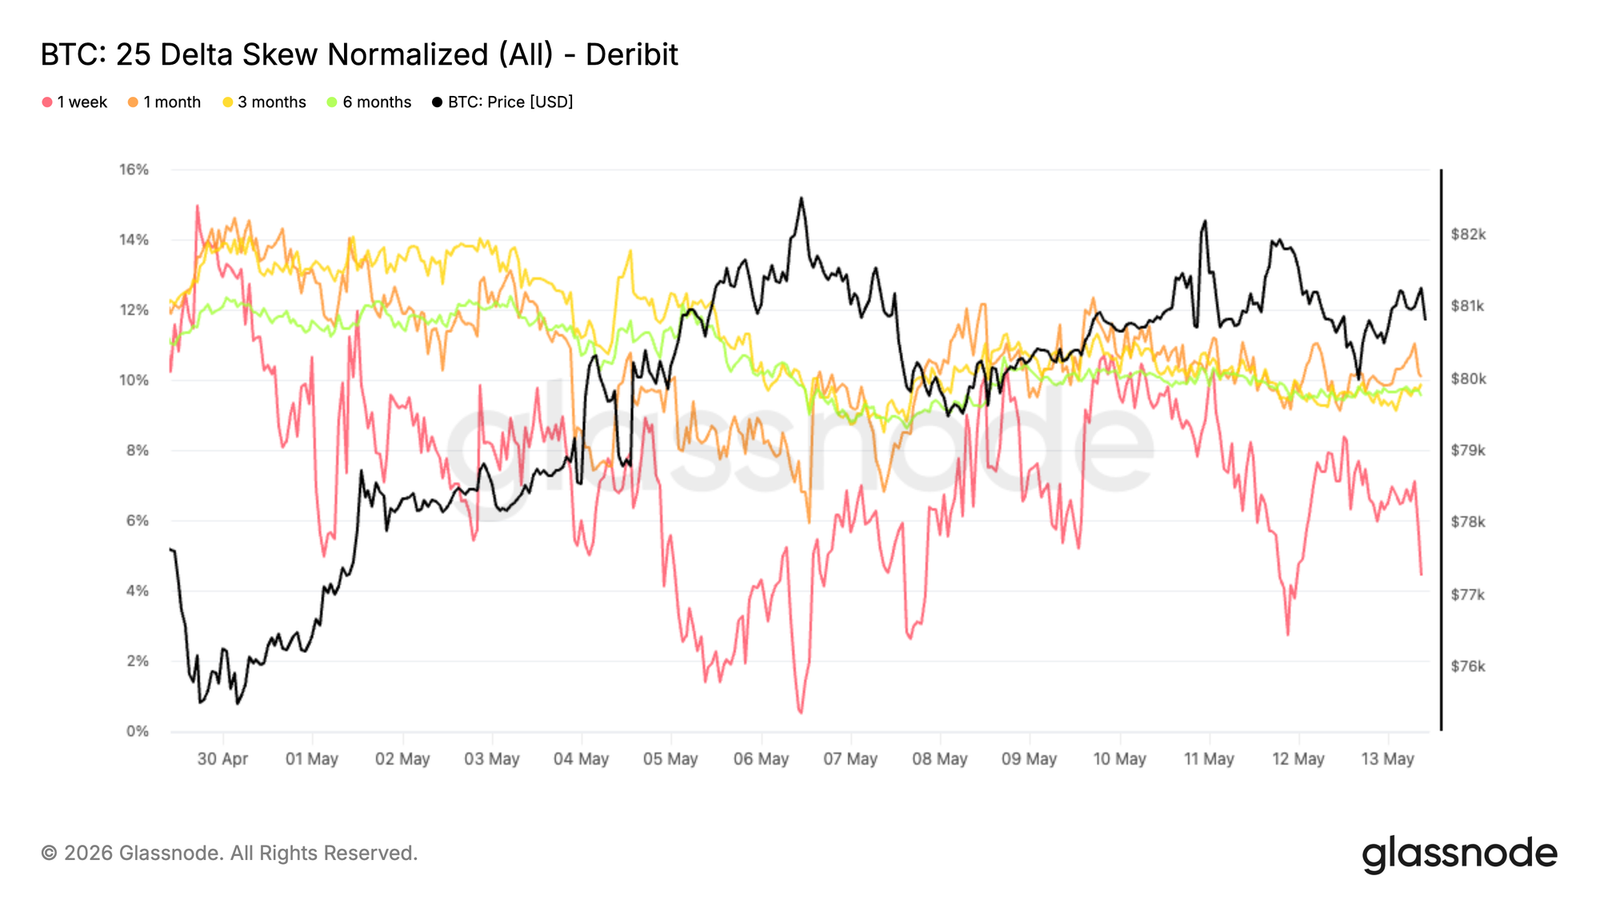
- The partial compression indicates a weakening of the demand for a downward hedge and a more balanced option structure around $80,000。
- Market silos remain a key driver of short-term dynamics, and a large number of negative Gamma clusters near $82,000 may still magnify price trends if spot flows back into the region。
Macro Insight
The macro background is still between slowing economic growth and persistent inflation. Recent inflation data in the United States are stronger than expected, and the labour market is more resilient than many expected. As a result, the market has further slowed down its interest rate expectations, maintaining a high rate of return on national debt and relatively tight financial conditions。
Liquidity remains a key driver of risk assets. Stock markets continue to grow slowly, but the underlying environment remains fragile and markets are adapting to the reality of higher and longer interest rates. At the same time, the strength of oil and bulk commodities continues to push up inflation expectations, especially against the backdrop of persistent geopolitical tensions。
FOR DIGITAL ASSETS, THE PICTURE REMAINS CONSTRUCTIVE BUT SELECTIVE. DESPITE TIGHT LIQUIDITY CONDITIONS AND THE STRENGTH OF THE UNITED STATES DOLLAR, BITCOIN HAS SHOWN RESILIENCE, INDICATING THAT THE BOTTOM DEMAND REMAINS INTACT. HOWEVER, ETF INFLOWS ARE SOFT AND HIGH REAL RETURNS SUGGEST THAT A MORE SUSTAINED UPWARD TREND MAY REQUIRE FINANCIAL EASING OR NEW CATALYSTS TO REKINDLE BROADER RISK PREFERENCES。
Insight on the chain
From fear to uncertainty
Against the macro background of visceral inflation, high yields on national debt and tighter financial conditions, Bitcoin continues to show relative resilience, suggesting that even though the broader risk environment remains unstable, bottom demand remains intact. In order to assess structurally the location of the current cycle, the relative unrealized losses (measured as a percentage of the total market value of the unrealized losses held by all investors) provide an accurate periodic barometer. This indicator peaked at 25 per cent of the market value during the February crash, a reading indicating significant pressure but still well below the extreme levels previously recorded in bear market cycles. With the subsequent recovery of $80,000, the target has been reduced to about 8 per cent, a shift away from fear to uncertainty rather than total collapse。
If $60,000 proved to be the low point of the cycle, the bear market would be the shallowest since the record — a record of fear, but far from the broad-scale dishwashing that has historically marked the end of the lasting cycle。
Size of capital inflows
As emotions move from fear to uncertainty, the key question is whether the current rebound is a typical bear market rebound or the early stages of a real cattle market transformation. The most direct measure is to observe net capital inflows, i.e., the realized market value of 30 days of net holding changes, which track monthly changes in total capital stored in the chain. With the recent rebound to $82,000, this target has reached $2.8 billion per month, which explains the constructive momentum of recent weeks。
However, the context is critical: in the early stages of major rounds of increase in cattle towns in 2023-2025, the target accelerated rapidly from about $2 billion per month to over $10 billion. While the current reading is encouraging, it is still well below that threshold, indicating that capital inflows that support this recovery lacked the conviction of a similar point in the previous cycle。
Support and resistance through a cost-based perspective
Despite a rebound of between $60,000 and $82,000 37 per cent, capital inflows remained moderate and uncertainty persisted, with the achievement of price targets by holding period providing a fine particle scale framework for identifying the most direct levels of support and resistance. The model tracks the average purchase price of the currency by holding period and maps the behavioural anchors of different investor groups on price charts。
The current rebound is largely driven by the cumulative wave of the past 30 days, which is currently based on costs of approximately $769 million and forms the most direct support floor in the short term. Above, the cost base of investors accumulated between November and February during the market run-off was concentrated around $869 million, representing the most likely areas of resistance in the near future as the holders approached the balance of gains and losses and faced growing distribution incentives。
Underlink Insight
ETF NEEDS RECONSTRUCTION
THE CURRENT BITCOIN ETF INFLOWS TO THE UNITED STATES HAVE CHANGED TO CLEAR POSITIVE VALUES IN RECENT WEEKS AND CONTINUE TO RETURN WITH THE RETURN OF THE BITCOIN OVER $80,000. AFTER MONTHS OF VOLATILE DEMAND AND A SIGNIFICANT OUTFLOW IN THE FIRST QUARTER, THE LATEST SHIFT INDICATES THAT INSTITUTIONAL DEMAND IS BEGINNING TO RE-EMERGE IN A MORE MEANINGFUL WAY。
IMPORTANTLY, THE RECOVERY IN ETF DEMAND HAS BEEN SUSTAINED RATHER THAN DRIVEN BY A SURGE IN SINGLE CONFIGURATIONS, INDICATING THAT INSTITUTIONS ARE ACCUMULATING STEADILY AS MARKET CONDITIONS IMPROVE. INFLOW INTENSITY HAS ALSO ACCELERATED WITH PRICES, REINFORCING THE VIEW THAT TRADITIONAL CAPITAL ONCE AGAIN SUPPORTS MOMENTUM RATHER THAN RETREATING。
THE CURRENT STRUCTURE IS A SIGNIFICANT IMPROVEMENT OVER THE MARKET STRUCTURE THAT WAS SHOWN EARLIER THIS YEAR. ETF INFLOWS ARE NOW A SOURCE OF WIND RATHER THAN SUSTAINED PRESSURE, REDUCING ONE OF THE KEY BARRIERS THAT PREVIOUSLY LIMITED RECOVERY ATTEMPTS. IF SUSTAINED, CONTINUED INSTITUTIONAL ACCUMULATION MAY PROVIDE THE REQUIRED DEMAND BASE FOR BITCOIN TO CHALLENGE HIGHER-UP SUPPLY ZONES IN THE COMING WEEKS。
Coinbase spot buys again
Coinbase FMTs have dramatically shifted to positive values over the past two weeks, with the return of Bitcoin to a low of $80,000 and the return of radical buyers. This recent shift contrasts sharply with the continued pressure on sales during most of the first quarter, when negative trades continued to enhance operational performance。
Importantly, the recent highs are accompanied by repeated increases in positive spot purchases, rather than a surge in isolated purchases, indicating that continuing demand is beginning to absorb supplies above. The enhancement of Coinbase activities is also highly consistent with the recovery of ETF inflows, indicating the renewed involvement of home-grown and institutional buyers in the United States。
The current structure indicates that spot demand is again becoming a source of price support rather than distribution. The continued strong buyer flow in Coinbase, especially in parallel with the rising inflow of ETF funds, shows that market conviction is improving and that the latest rebound has a healthier bottom-up demand situation。
Hyperliquid traders are looking at more and more
Over the past few weeks, the warehouse position on Hyperliquid has become more lopsided, and the BTC net hold has risen steadily as Bitcoin has returned to a low of $80,000. This shift marked a marked reversal from the continuing empty bias that dominated the market for most of the first quarter, when the market fell back to a low of $60,000。
Importantly, the recent increase in multiple openings has been a gradual development rather than a surge through a single crowded warehouse, indicating that traders are steadily rebuilding their openings as market conditions improve. The net holdout is now close to the strongest perception of multiple bias since the end of 2025, reflecting increased confidence in the continuation of the movement。
The persistence of multiple silos as price movements rise indicates a better mood of traders and a more constructive speculative context, although increasingly crowded openings may make markets more sensitive to short-term fluctuations and warehouse-driven retreats。
Implicit volatility is low
Over the past week, the implicit rate of movement of bitcoin has moved downward, from 39 per cent to 34.6 per cent the previous month. Longer durations are also synchronized, with curve durations declining by approximately 1 to 2 volatility points。
This trend reflects a downward trend in the overall re-pricing of the maturation structure as traders lower expectations of short-term fluctuations. The decline followed the recent rebound in volatility and was accompanied by more controlled spot operations, reinforcing the perception that markets were returning to a more calm pattern。
With the compression of implied fluctuations, the costs of term options fall, especially at the front end, which is most sensitive to changes in short-term warehousing and demand。
The current structure reflects a reduction in market pricing for large forward movements, and the supply of volatility continues to exceed the duration of the curve。
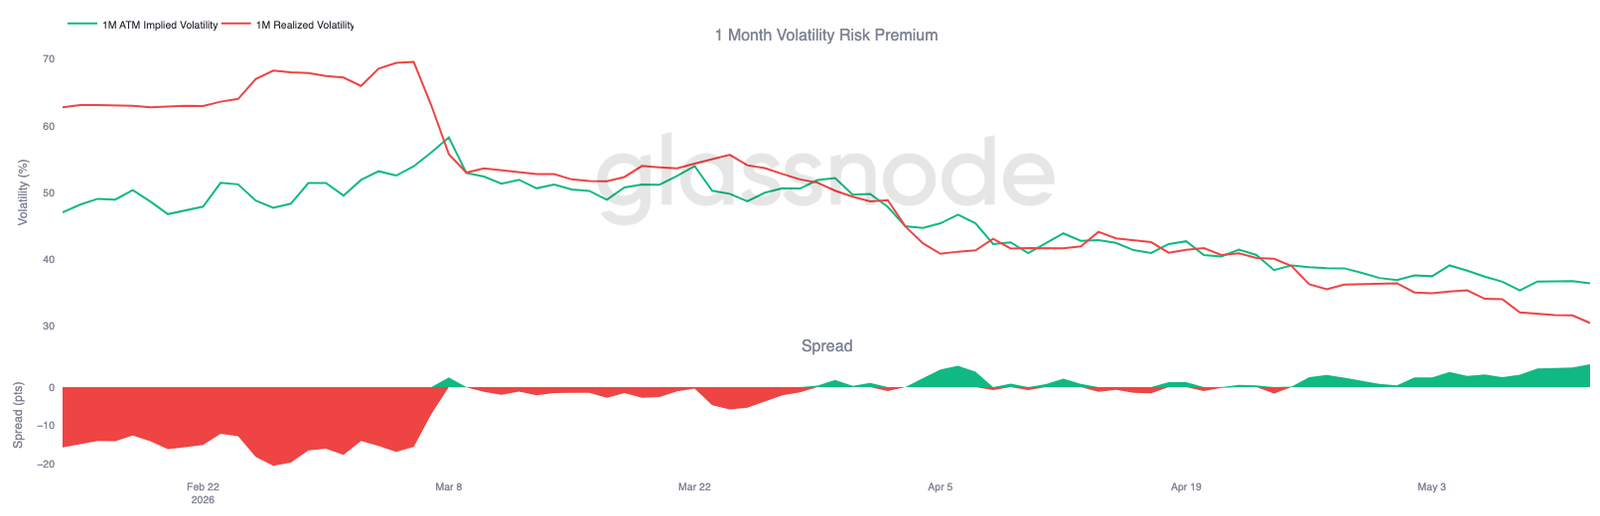
Keep the volatility risk premium positive
While the implied rate of volatility has been consistently compressed over the duration of the curve, it has been achieved faster. Bitcoin has achieved 30 days of volatility, which is currently 30.48 per cent, and has steadily declined over the past few weeks as spot operations are relatively controlled。
At the same time, the previous month ' s implied rate of volatility remained at approximately 36.4 per cent, which is still implicitly above the realized rate and maintains a positive volatility risk premium. In other words, options continue to price more volatile deliveries ahead of recent spot fluctuations in bitcoin。
The spread between implied and realized volatility rates has also been rebuilt over the past two to three weeks, from a brief compression in April to a return to six volatility points. This indicates that, although the overall rate of volatility has been reset downwards, the demand for options remains high relative to the realized fluctuations。
Thus, although the overall volatility rate continues to soften, implicitly and with two dimensions achieved, the hedging conditions still favour the volatility seller。
Paradigm compression indicates a weakening of the demand for the next line
as fluctuations are expected to continue to reset the rows, the deviations normalize over the duration of the curve. this trend is most evident at the front end, where the 25 delta bias has been reduced from around -10% to -4% in the past week. longer durations are also synchronized, with one month, three months and six months losing about one to two points of drop price。
It is noteworthy that this compression took place against the backdrop of a bitcoin rounded up around $80,000 and weak macro-background support. The surface of the option does not show an increase in the demand for lower protection, but rather continues to re-pricing to a more balanced structure。
This upward trend reflects a steady decrease in the premium of the margin over the margin, indicating that the demand for protection down the curve ' s deadlines is diminishing rather than increasing。
While the maturities are still in the drop zone, the continuing compression indicates that the demand for a downward hedge is slowing rather than increasing。
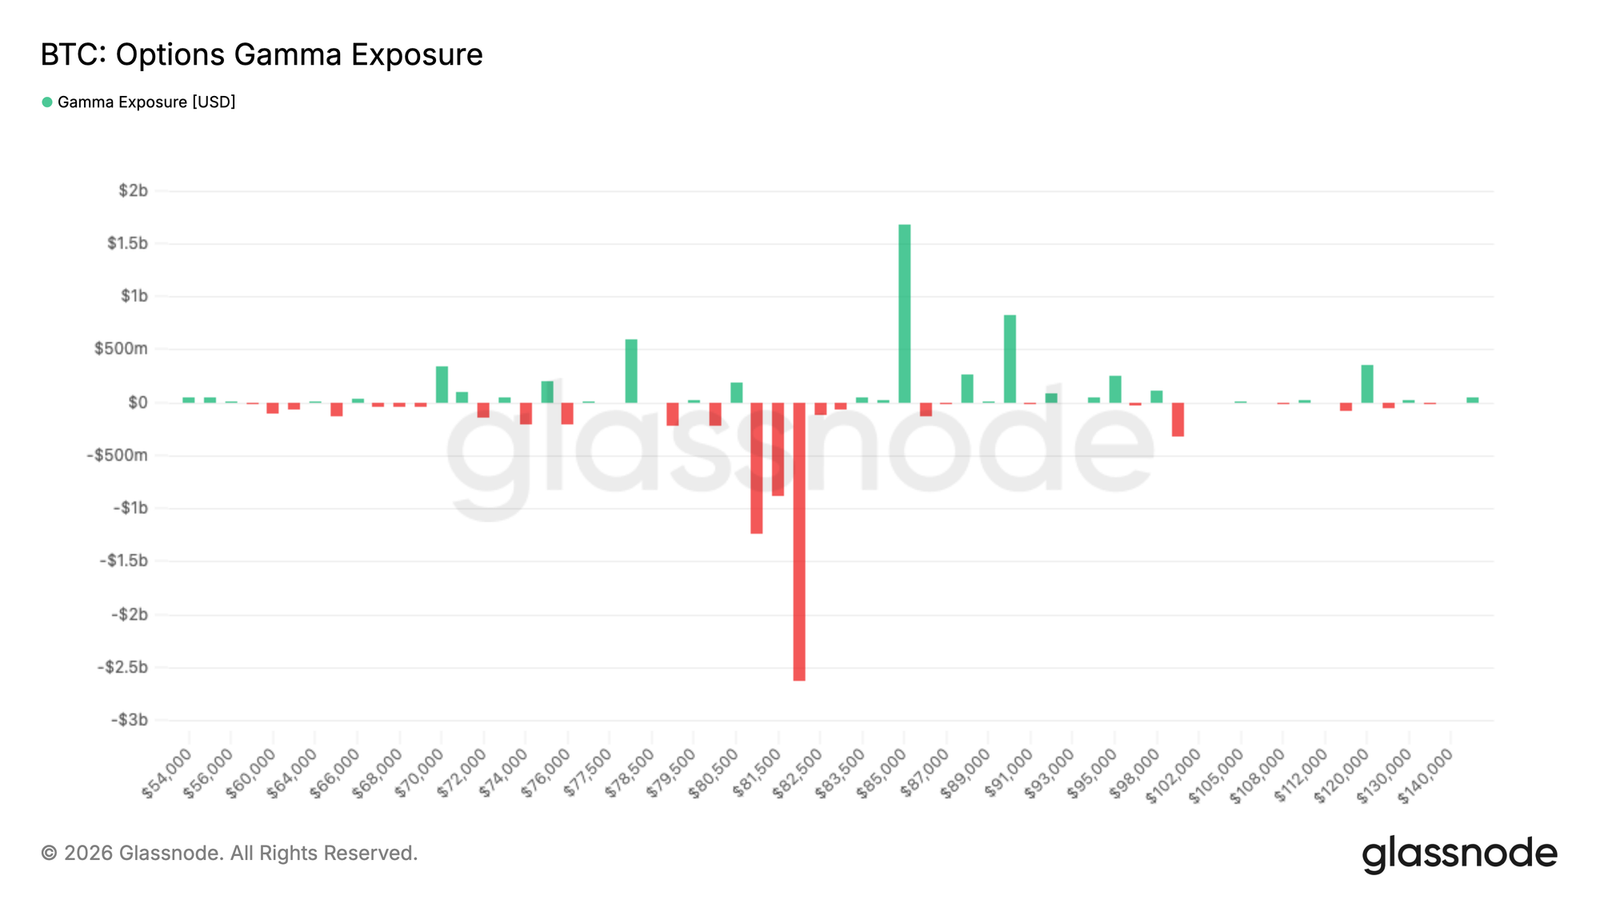
Gamma made the spot sensitive around $82,000
Market silos continue to create reactive structures around current price levels. Negative Gamma has a maximum concentration of $82,000 in right-to-hand prices of approximately $2.6 billion, while Gamma accumulates near $85,000, close to $1.8 billion。
Since cash remains below the $82,000 negative Gamma cluster, the re-entry of prices into the region could trigger a reactive trade-off flow, boost momentum and magnify price trends. Above that, positive Gamma concentration near $85,000 may contain volatility。
Financial flows also reflect a shift in position. Over the past seven days, downside options have been bought at 71 per cent of the premium, reflecting the high demand for downside protection in the recent round. Fifty-eight per cent of the recent 24-hour traffic comes from the sale of drop options, suggesting that some of the hedges are being levelled。
This structure allows the market to re-enter a large number of negative Gamma clusters near $82,000, increasing sensitivity to magnifying hedge flows。
Conclusions
IN SUM, THE RECOVERY OF BITCOIN HAS CONTINUED TO GROW UNDER THE SURFACE, WITH THE RE-EMERGENCE OF SPOT-LED DEMAND, ETF INFLOWS AND IMPROVED SPECULATIVE POSITIONS CONTRIBUTING TO A MORE CONSTRUCTIVE MARKET STRUCTURE. THE SHARP COMPRESSION OF RELATIVE UNREALIZED LOSSES AND THE STABILIZATION OF PROFITABILITY AND LIQUIDITY INDICATORS ALONG THE KEY CHAINS SUGGEST THAT THE FALL IN FEBRUARY IS INCREASINGLY SEEN AS A CYCLICAL REPLACEMENT RATHER THAN THE BEGINNING OF DEEPER BEAR MARKETS。
At the same time, this round of rebounds is marked by a marked difference from the radical expansion of the period 2023-2025. Capital inflows are recovering, but they are still well below the previously breakthrough threshold, while the shrinking volatility and more calm derivative silos point to markets that are gradually rebuilding confidence rather than entering a fanatical phase. This makes the current increase more like a structurally supported recovery than a fully recognized breakthrough in momentum。
With Bitcoin now re-entering a dense supply area between $82,000 and $87,000, markets are entering areas where prices are becoming increasingly important. Maintaining the region on a sustainable basis will likely require greater spot participation and deeper capital rotations to absorb the remaining supply. Until then, broader structures continued to improve, but faith seemed to be rebuilding rather than returning completely。
