2% of users contribute 90% of transactions: the real picture of Polymarket
Is Polymarket a dispersed position or an agency?
this post is part of our special coverage syria protests 2011
Photo by Chopper, Foresight News
Most of the reports on Polymucket are based on superficial data: transaction milestones, growth of users, transaction numbers, silo positions, and never look into who is trading behind these figures. This paper categorizes all active wallets from two dimensions of the transaction frequency and volume, outlining the real user image structure of Polymarket。
Polymarket, the vast majority of transactions, is contributed by a small group of batches and high frequency transactions; low-volume, low-frequency bulkers, with which there is virtually no overlap. To identify the differences between the two groups of people, decisions are made directly on the platform ' s fee design, product priority planning and the strategic layout of the market class。
Note: All data in this document are from the Dune Data Viewer and the analysis cycle covers almost three months of full wallet-level behaviour; user graphics are based on the transaction frequency ranking (T1-T7) and transaction value ranking (V1-V7) in United States dollars。
User transaction frequency and volume distribution
The transaction frequency presents a typical logarithmic distribution decay. The largest group of users had between 2 and 10 transactions throughout the study cycle, accounting for 32 per cent of all users. Together with the number of transactions between 11 and 50, almost two thirds of the total number of users. These people are usually involved in transactions during elections, sporting events or major macroeconomic events, and are charged a small amount of money。
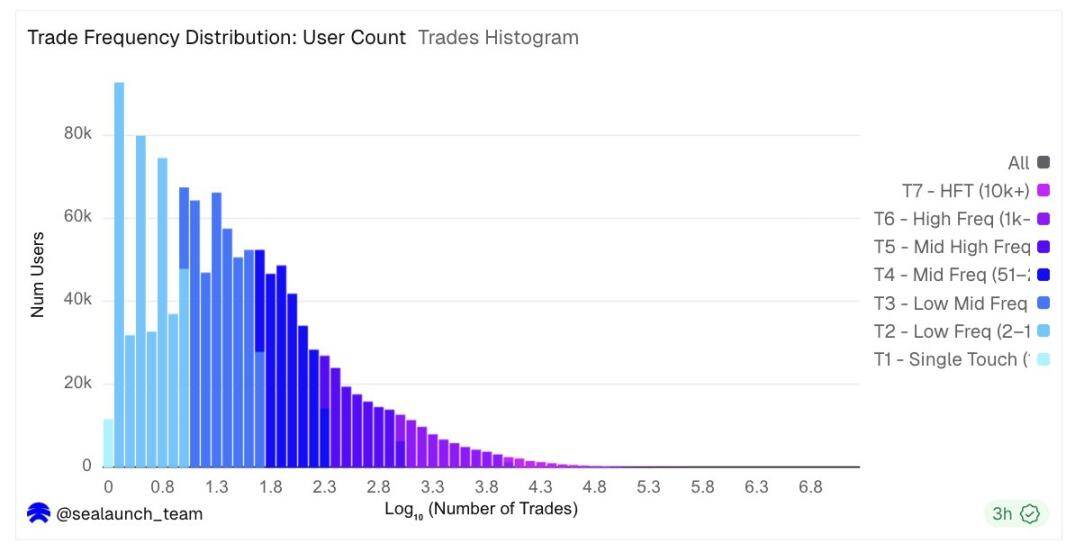
Transaction frequency distribution
The distribution of transactions is quite different. Although the transaction frequency fell sharply from the left side, the heterogeneity pattern of the barter was bell-shaped under the logarithmic coordinates, peaking at about $600 to $3000 per user. This means that the typical active user transaction amounts to around four digits, but the small number of right-end users starting with $25,000 accounts for the bulk of the Platform's trade。
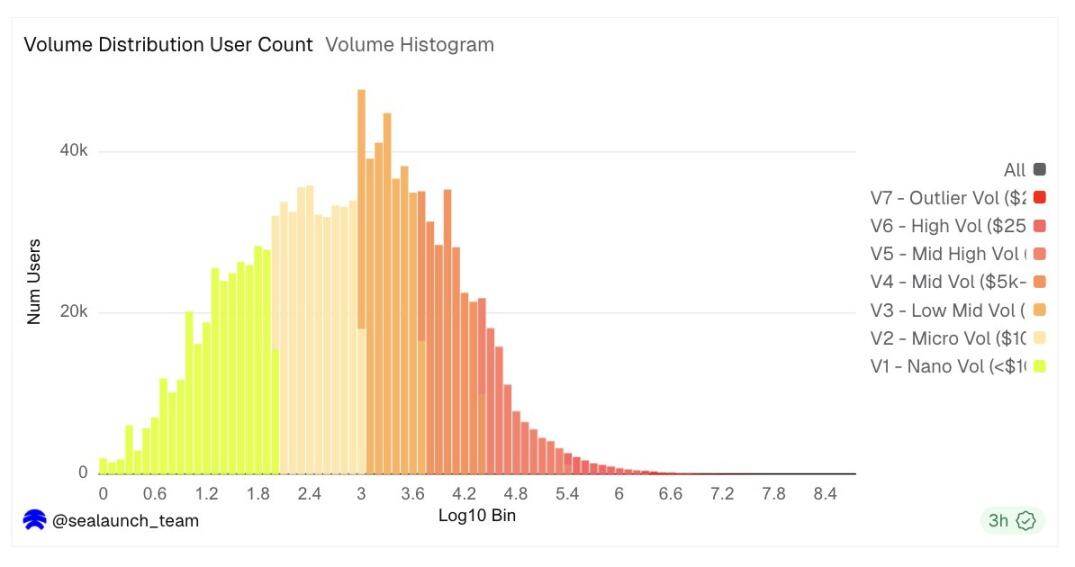
Trade volume distribution
Together, the two histograms reveal structural divisions: one is low-frequency participants; the other is high-trading participants, whose footprints are almost invisible in the user chart, but whose influence on the traffic chart dominates。
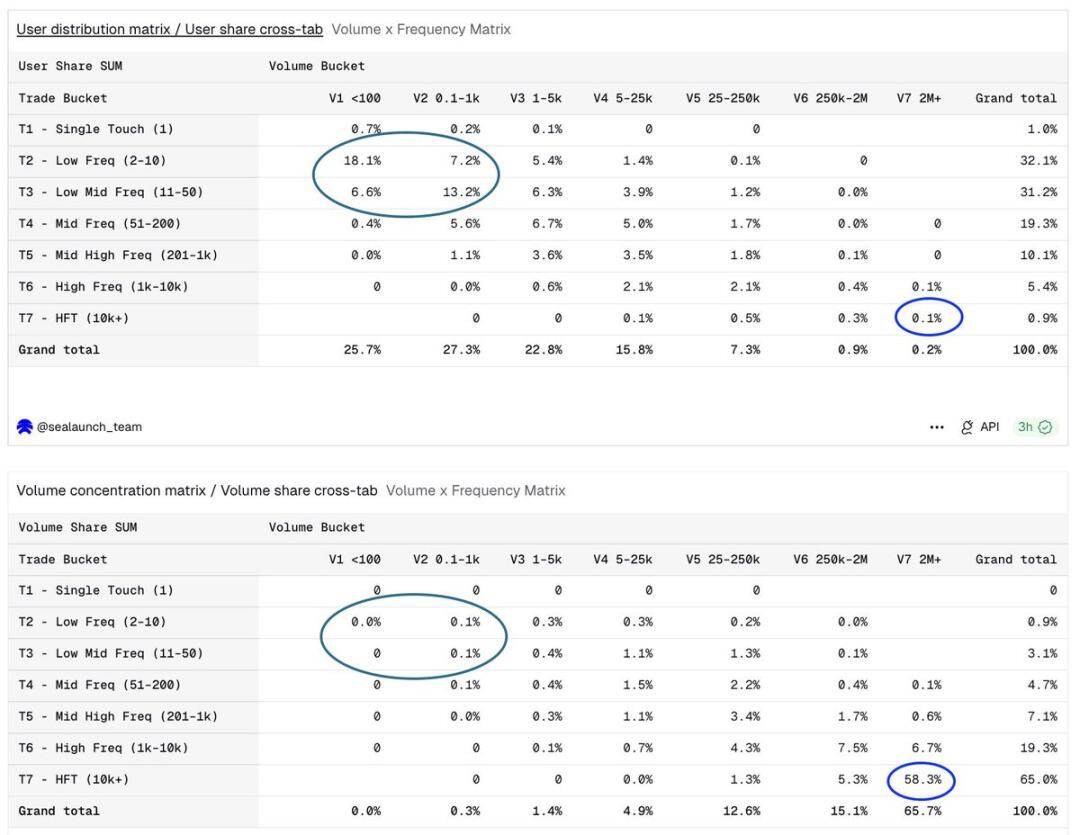
user ratio is more intuitive than & amp; body concentration matrix: user dimension is concentrated in low-frequency small area and the volume dimension is completely reversed
How the user image system works
Relying solely on frequency or volume to divide users ignores the linkage logic. The same 500 deals, totalling $50 and 500 deals totalling $5 million, are in both categories of participants. We combine these two dimensions and sort each wallet。
WE FIRST ASSIGNED EACH WALLET TO DIFFERENT TRANSACTION FREQUENCY LEVELS: FROM T1 (SINGLE TRANSACTIONS) TO T7 (OVER 10,000 TRANSACTIONS). WE THEN ASSIGNED IT TO DIFFERENT TRANSACTION LEVELS: FROM V1 (TOTAL TURNOVER BELOW $100) TO V7 (OVER $2 MILLION). THE INTERSECTION OF THESE TWO DIMENSIONS PRODUCES SEVEN USER IMAGES, EACH REPRESENTING A DISTINCT TYPE OF PARTICIPANT。
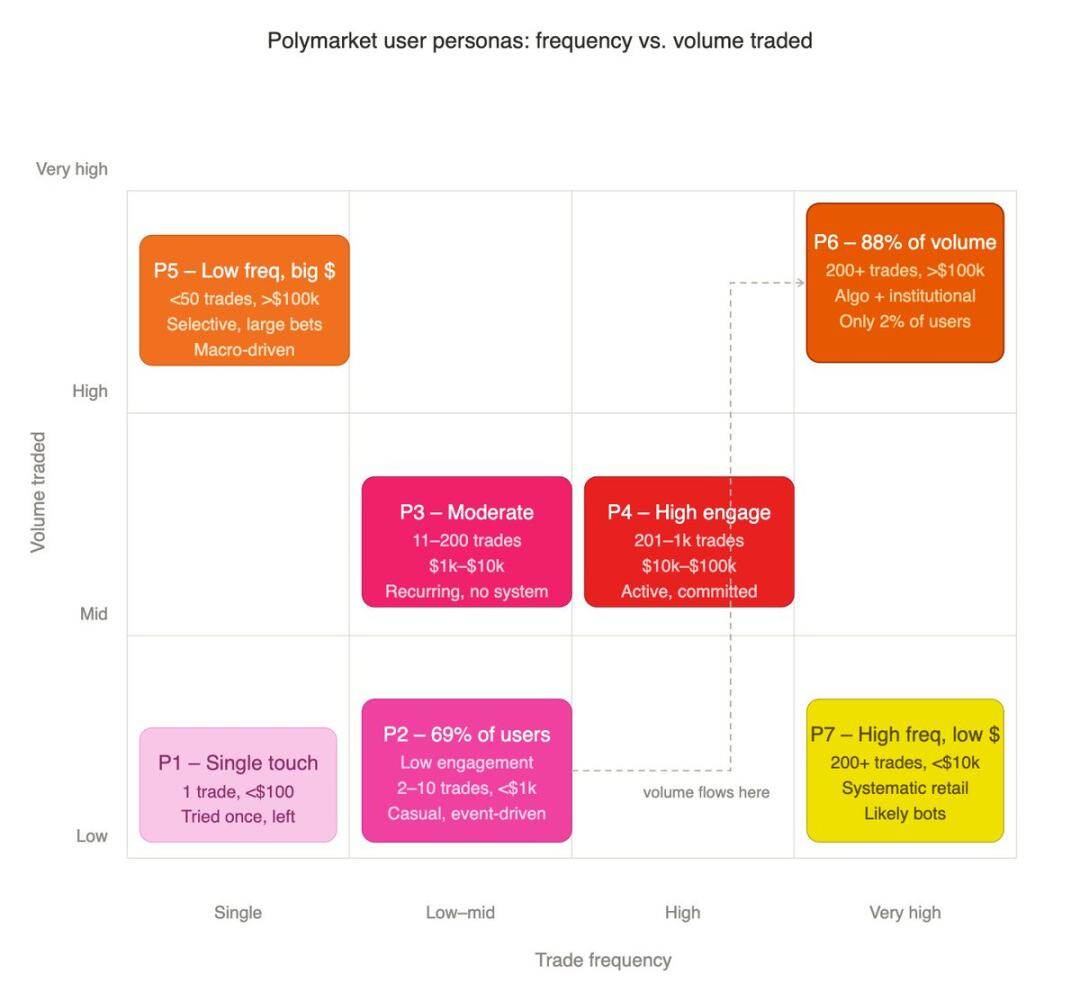
- P1 SINGLE SILENT USER: ONLY 1 TRANSACTION WITH A TOTAL VALUE OF LESS THAN $100, ONE-TIME WATER TESTING PLATFORM
- P2 LOW ACTIVE BULK: 2-10 TRANSACTIONS WITH A TOTAL VOLUME OF LESS THAN $1,000, PURE HOTSPOT EVENT DRIVEN BY RANDOM PARTICIPANTS
- P3 MEDIUM PARTICIPANTS: 11-200 TRANSACTIONS, VOLUME 1000-10,000 DOLLARS, REPEATED BUT UNSYSTEMATIC TRANSACTION LOGIC
- P4 HIGH-DEPTH BULK: 201-1000 TRANSACTIONS, VOLUME $10,000-$100,000, ACTIVE STABILIZATION BUT NOT INSTITUTIONAL LEVEL
- P5 LOW-FREQUENCY, HIGH-NET-VALUE HOUSEHOLDS: LESS THAN 50 TRANSACTIONS, ONE LARGE OVER $100,000, SELECTED OPPORTUNITIES, TARGETED RETOURS
- P6 HF PROFESSIONAL STRENGTH: OVER 200 TRANSACTIONS, OVER $100,000, ALGORITHMIC STRATEGIES AND GROUP OF INSTITUTIONAL TRADERS
- P7 HF SMALL PLAYERS: MORE THAN 200 TRANSACTIONS, TOTALLING LESS THAN $10,000, HIGH-LEVEL PARTICIPANTS WITH LIMITED CAPITAL
2% user, close to 90% transaction Volume
P2 LOW ACTIVE BULKINGS ARE AS HIGH AS 849,000, OR 69 PER CENT OF TOTAL USERS; P6 HF HIGH INPUT USERS ARE ONLY 27 MILLION, OR APPROXIMATELY 2 PER CENT。
HOWEVER, DURING THE STATISTICAL CYCLE, THE P6 GROUP GENERATED A TOTAL TURNOVER OF $39 BILLION. THIS IS THE MOST EXTREME EXPRESSION OF THE PARETTO LAW: NOT THE USUAL 80/20, BUT THE 2% USER UP CLOSE TO 90% OF THE TRANSACTION VOLUME。
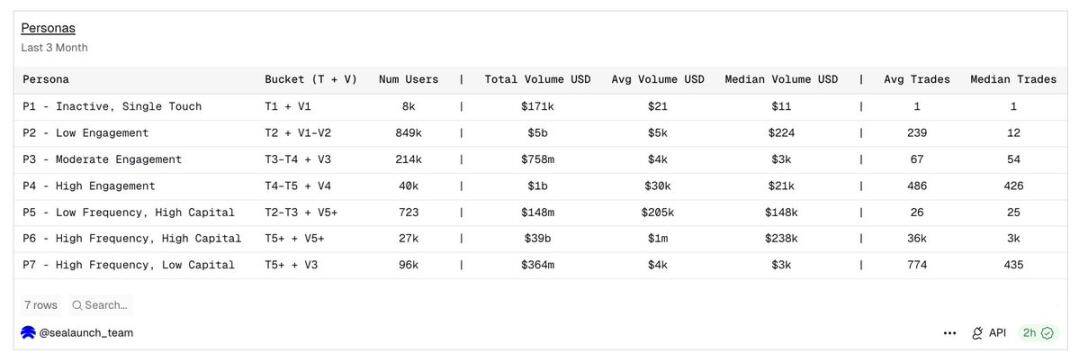
User image summary: intersection of transaction frequency and transaction size to produce seven main user types
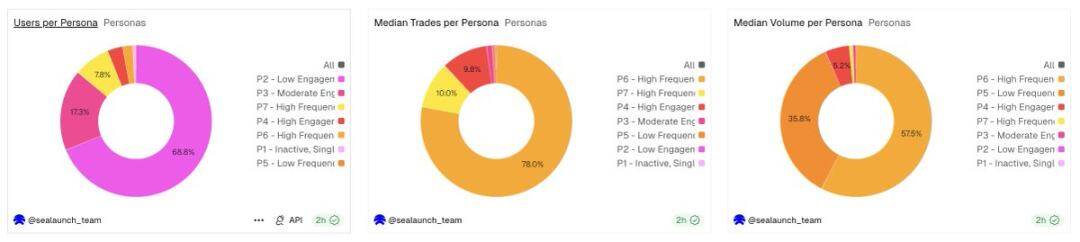
Number of people per user group, median number of transactions and median number of transactions: three sets of data present distinct characteristics of user distribution
User growth maps and turnover growth maps describe almost entirely different user groups. The platforms that target user growth and those that target trade volume growth are very different in terms of product decisions。
Type preference for different user images
Sports and encrypted currency are the two largest trade tracks in Polymark, accounting for 42 per cent and 31 per cent of total transactions, respectively, with large differences in the structure of the crowd behind them。
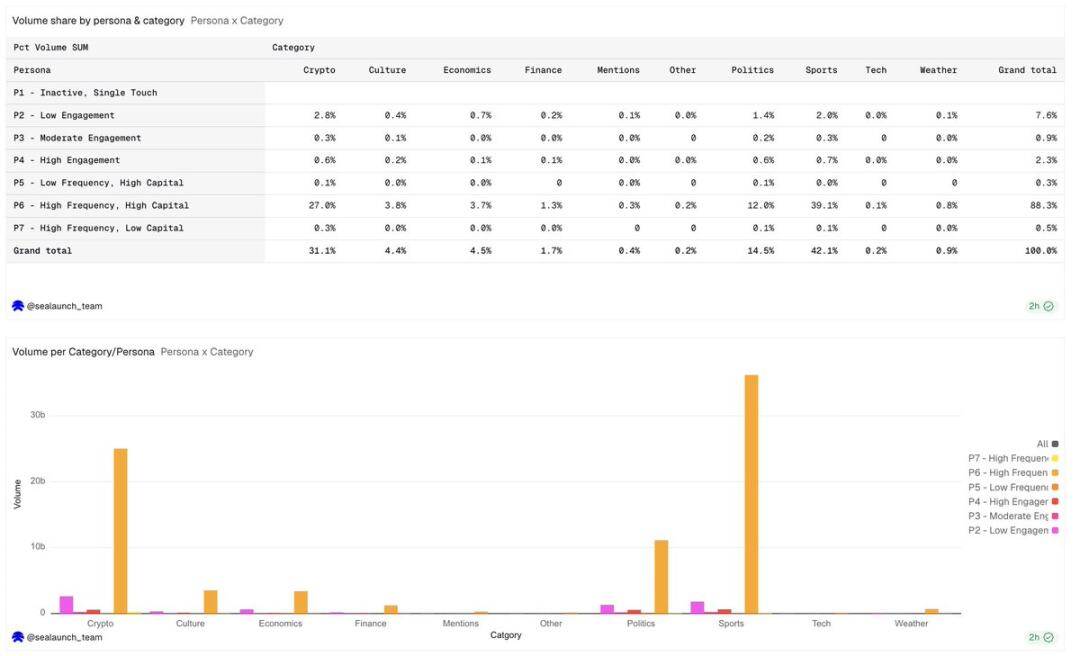
Proportion of transactions between different user profiles and trade items
THE RATIO OF HIGH-FREQUENCY (HF) HIGH-FUND (P6) TRADERS IN THE ENCRYPTED CURRENCY MARKET IS SIGNIFICANTLY HIGHER THAN THE OVERALL USER POPULATION, AND THIS PATTERN IS CONSISTENT WITH ALGORITHMIC TRANSACTIONS. THESE PARTICIPANTS ARE NOT RANDOM TELLERS, BUT USE A SYSTEMATIC STRATEGY TO TRADE IN ENCRYPTED CURRENCY. THE HIGH VOLUME AND FREQUENCY OF TRANSACTIONS SUGGESTS THAT TRANSACTION EXECUTION IS AUTOMATED RATHER THAN SUBJECTIVE。
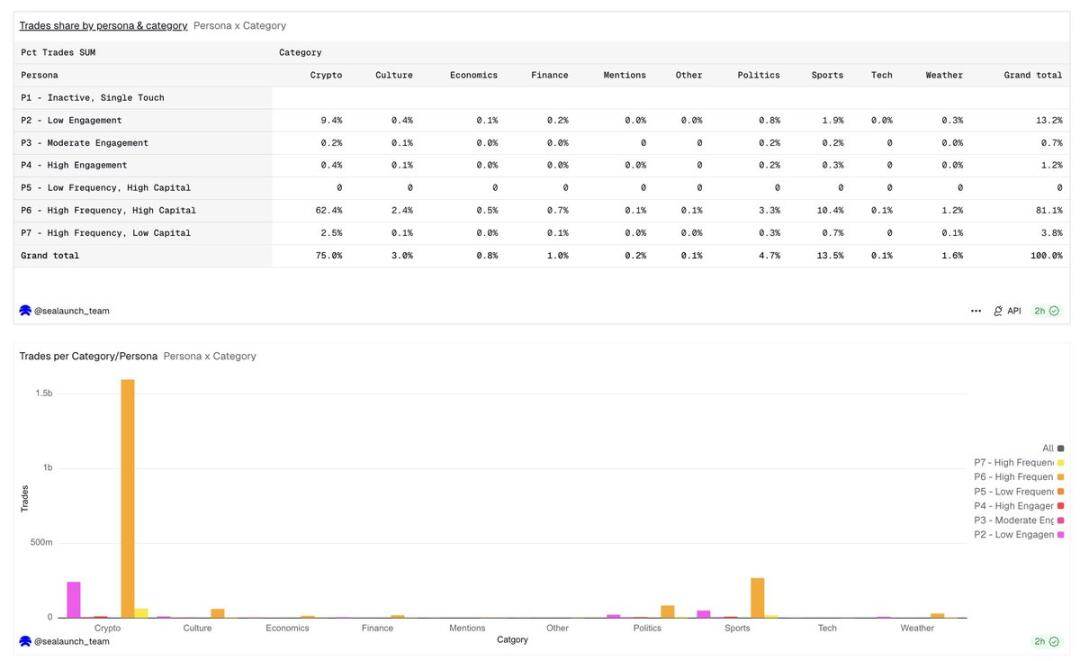
Number of crosses between different user images and products That's right
WHILE SPORTS FAIRS ARE ALSO DOMINATED BY HIGH FREQUENCY (HF) AND HIGH MONEY (P6) TRANSACTIONS, THE PERCENTAGES OF PARTICIPANTS ARE HIGHER THAN IN THE ENCRYPTED CURRENCY CATEGORY. SPORTS FAIRS HAVE BOTH INSTITUTIONAL ALGORITHMS AND A LARGE NUMBER OF SOPHISTICATED MANUAL RESEARCHERS, RELYING ON SUBJECTIVE JUDGEMENT TO FIRMLY LAY DOWN ORDERS RATHER THAN ON MACHINE HIGH FREQUENCY ITERATIVES。
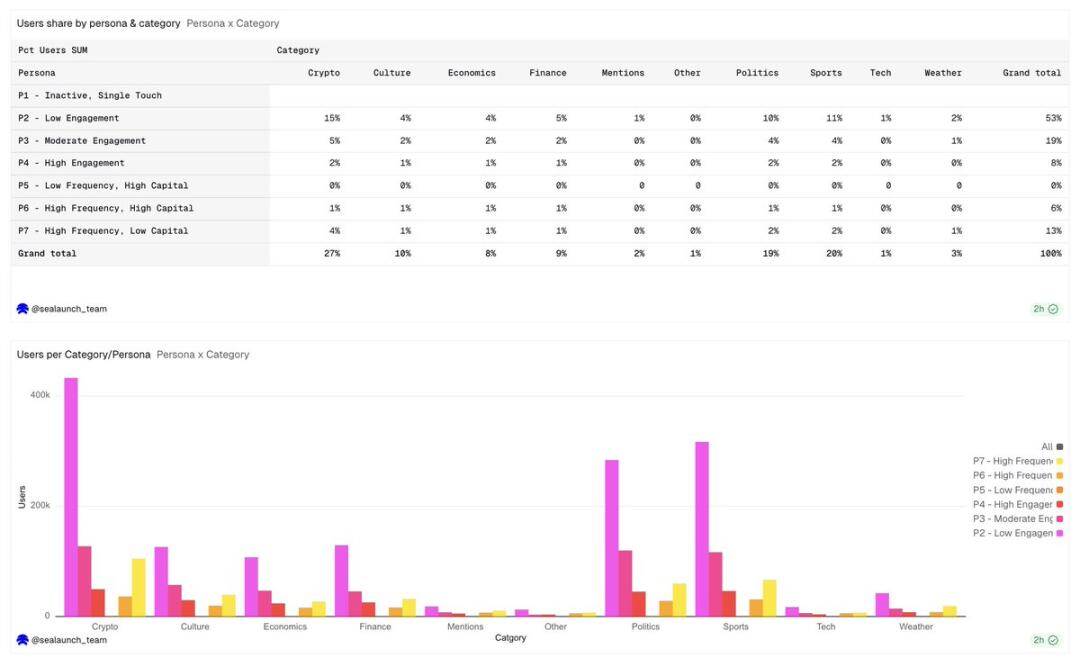
Proportion of users of different user images and products: the distribution of users contrasts sharply with the number of transactions, the number of transactions
THE HIGHEST PERCENTAGE OF USERS IN THE POLITICAL CATEGORY IS 19 PER CENT, BUT THE NUMBER OF USERS IS MORE EVENLY DISTRIBUTED AMONG THE VARIOUS USER GROUPS. LOW-PARTICIPATING USERS (P2) HAVE THE HIGHEST PERCENTAGE OF USERS IN THE POLITICAL CATEGORY, AND SUCH USERS ARE USUALLY EVENT-DRIVEN, ONE-OFF BULKERS, COMPARED TO OTHER CATEGORIES, WHO REGISTER THEIR ACCOUNTS FOR ELECTION STAKES。
THE DISPROPORTIONATE PRESENCE OF LOW-FREQUENCY HIGH-CAPITAL (P5) PARTICIPANTS IN THE ECONOMIC AND FINANCIAL SPHERES HAS MEANT THAT THE NUMBER OF TRANSACTIONS BY THE PARTICIPANTS IS LOW, BUT THE AMOUNT OF THE SINGLE TRANSACTION IS LARGE, AND THEY INVEST LARGE AMOUNTS OF CAPITAL IN MACROECONOMIC OUTCOMES, WHILE THE NUMBER OF TRANSACTIONS IS RELATIVELY LOW。
The top quality of the platform directly determines the user group attracted and affects the depth of mobility, user retention and affordability。
A NEW ENCRYPTED CURRENCY MARKET ATTRACTS ALGORITHMS AND HIGH-FREQUENCY TRADERS; A NEW POLITICAL MARKET ATTRACTS EVENT-DRIVEN PARTICIPANTS WHO MAY NEVER RETURN AFTER THE EVENT. A MORE SPECIFIC FORM OF MARKET, SUCH AS BINARY OPTIONS OR STRUCTURED RESULT MARKETS, MAY FURTHER ATTRACT HIGH-FREQUENCY (HF) HIGH-CAPITAL (P6) USER GROUPS, WHICH ARE ALREADY DOMINATED BY SYSTEM TRADERS. IF THE TARGET IS TRANSACTION VOLUME, THEN BUILD FOR THE P6 USER GROUP. IF THE GOAL IS USER GROWTH AND BRAND INFLUENCE, IT IS BUILT FOR THE P2 USER GROUP. THESE TWO OBJECTIVES REQUIRE VERY DIFFERENT PRODUCT CHOICES。
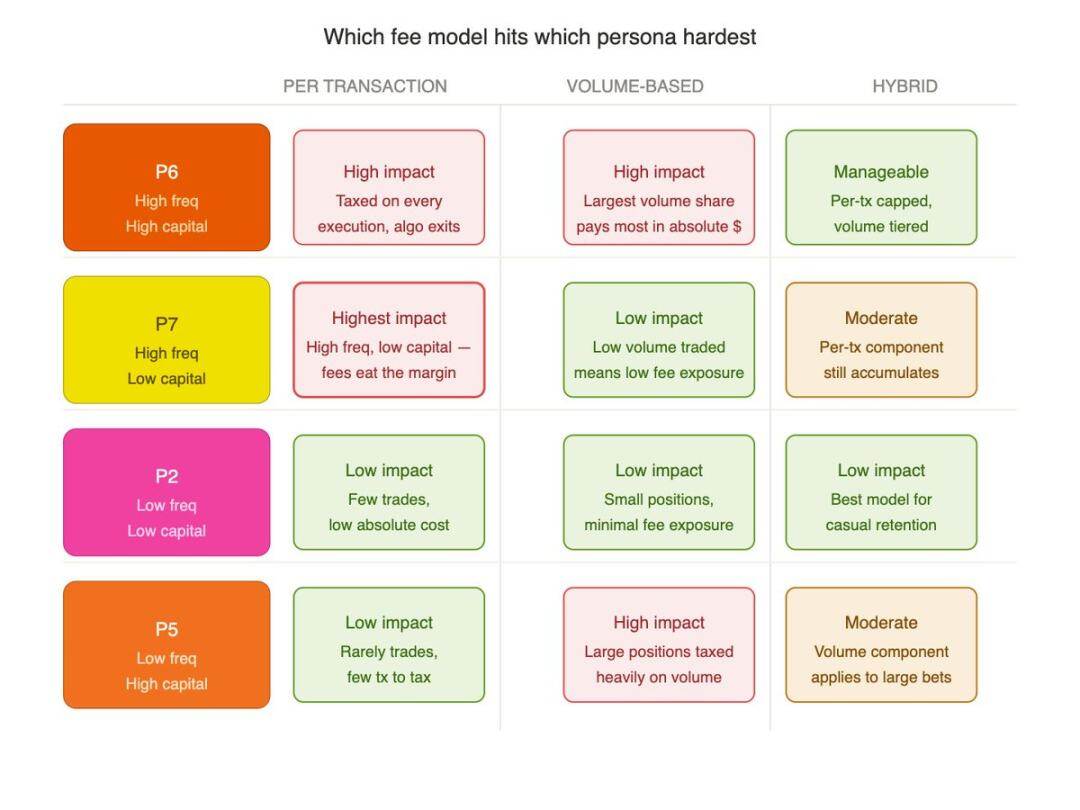
Revelations on fee models
A user layer image that directly determines the design of the transaction costs for predicting the market。
THE FIXED SINGLE-CHARGE MODEL OVERSTRETCHS THE P6 HF HIGH-CAPITAL, P7 HF SMALL POPULATION, WHICH SUPPORTS THE MOBILE CHASSIS ON WHICH THE PLATFORM IS BASED。
The value of the product differential rate is here, and the current system of rates in Polymark is the logical setting:
- Maximum encryption plate effective rate: 1.80%
- Sports block: 0.75 per cent
- political & financial sector: 1.0%
- Geopolitics block: full zero fee
THIS SET OF STANDARDS IS BY NO MEANS RANDOM, BUT IS A PRECISE MATCH BETWEEN THE POPULATION STRUCTURE AND TRADING HABITS OF EACH CLASS. ENCRYPTION TRACKS ARE FULL OF P6 ALGORITHMIC EXPERTISE AND BEAR HIGH RATES THAT DO NOT UNDERMINE MOBILITY; POLITICAL TRACKS ARE DOMINATED BY LOW-THRESHOLD CARAVANS AND MUST BE KEPT AT LOW FRICTION COSTS. IT'S ESSENTIALLY A BLIND TEST TO DO THE RATE DESIGN AWAY FROM THE USER IMAGE。
Core conclusions
- P6 HF HIGH CAPITAL GROUP ONLY 2 PER CENT OF USERS, CREATING PLATFORMS 88 PER CENT OF TRANSACTIONS
- (A) THE POLICY OF FEES AND CHARGES TO THE DETRIMENT OF P6 WILL SERIOUSLY DAMAGE THE PLATFORM ' S FOUNDATIONS
- 69% of users are low-frequency small-scale bulks driven by pure hotspot events
- Encryption transactions are highly concentrated on high-frequency algorithms and sports track participants are structured more in dollars
- The average number of transactions concluded within 90 days by ordinary users was only 12, with a median total input of $224
- The expansion of new products requires anchoring of target user images rather than simply following the subject heat。
Concluding remarks
If the trade is concentrated in a small core area of high frequency, why does Polymark have to position itself as a retail product? While professional algorithms support the vast majority of water flows, product experiences, marketing practices, product layouts have always moved to the general diaspora。
PART OF THE ANSWER MAY LIE IN STRUCTURAL FACTORS. SMART FRAMEWORK, TELEGRAPH ROBOTICS, UNCODED TOOLS ARE WIDELY AVAILABLE, AND IT IS EASY FOR THE DIASPORA TO TRADE AUTOMATICALLY. IF THE BULK HAS NOW STARTED TO TRADE IN ALGORITHMS, THEN THE NEXT STEP NATURALLY EVOLVES INTO AI INTELLIGENCE AUTONOMOUS LARGE-SCALE HIGH-FREQUENCY OPERATIONS。
And that's why Polymarket is likely to produce the first killer-level application in the field where encrypted money intersects with artificial intelligence. In a market that is highly mobile, event-driven and with either outcome or outcome, autonomous agents can operate with precision, absorbing information from world events, social emotions and real-time reasoning, identifying the outcome of transactions with incorrect pricing and executing transactions without artificial intervention. When the application reaches groundbreaking progress, it is more than just an encrypted currency product. This will be the moment when the agent transaction moves to the mass market。
